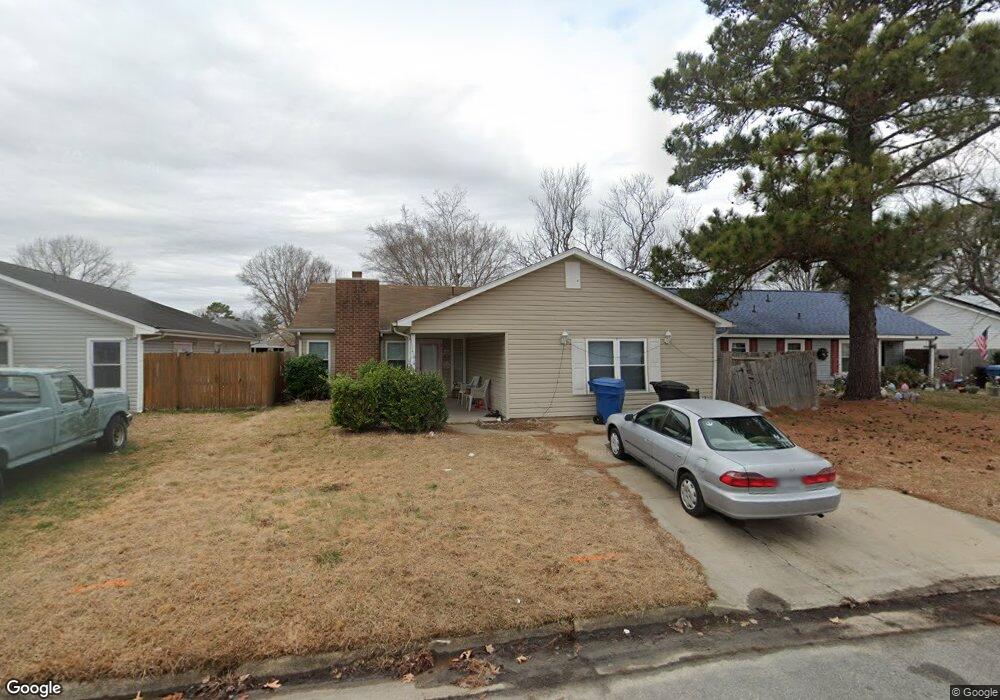
3512 Dandelion Crescent Virginia Beach, VA 23453
Green Run NeighborhoodEstimated Value: $291,000 - $361,000
3
Beds
2
Baths
1,868
Sq Ft
$182/Sq Ft
Est. Value
About This Home
This home is located at 3512 Dandelion Crescent, Virginia Beach, VA 23453 and is currently estimated at $339,112, approximately $181 per square foot. 3512 Dandelion Crescent is a home located in Virginia Beach City with nearby schools including Green Run Elementary School, Larkspur Middle School, and Green Run High School.
Ownership History
Date
Name
Owned For
Owner Type
Purchase Details
Closed on
Oct 8, 2024
Sold by
Trustee Services Of Virginia Llc
Bought by
Truist Bank
Current Estimated Value
Purchase Details
Closed on
May 24, 2022
Sold by
Joseph B Barbero Revocable Living Trust
Bought by
Cartwright Melanie Ann
Home Financials for this Owner
Home Financials are based on the most recent Mortgage that was taken out on this home.
Original Mortgage
$309,294
Interest Rate
5.25%
Mortgage Type
FHA
Purchase Details
Closed on
May 3, 2021
Sold by
Barbero Joseph B
Bought by
Joseph B Barbero Revocable Living Trust and Barbero
Purchase Details
Closed on
Apr 28, 2021
Sold by
Barbero Joseph B
Bought by
Barbero Joseph B and Barbero Joseph B
Purchase Details
Closed on
Nov 14, 2018
Sold by
Waff Ernest Wayne and Waff Glenda Ruth
Bought by
Barbero Joseph B and Barbero Lumen C
Create a Home Valuation Report for This Property
The Home Valuation Report is an in-depth analysis detailing your home's value as well as a comparison with similar homes in the area
Home Values in the Area
Average Home Value in this Area
Purchase History
| Date | Buyer | Sale Price | Title Company |
|---|---|---|---|
| Truist Bank | $285,600 | None Listed On Document | |
| Truist Bank | $285,600 | None Listed On Document | |
| Cartwright Melanie Ann | $315,000 | Brunick Kevin M | |
| Joseph B Barbero Revocable Living Trust | -- | None Listed On Document | |
| Barbero Joseph B | -- | None Available | |
| Barbero Joseph B | $227,600 | Seashore Title & Settlements |
Source: Public Records
Mortgage History
| Date | Status | Borrower | Loan Amount |
|---|---|---|---|
| Previous Owner | Cartwright Melanie Ann | $309,294 |
Source: Public Records
Tax History Compared to Growth
Tax History
| Year | Tax Paid | Tax Assessment Tax Assessment Total Assessment is a certain percentage of the fair market value that is determined by local assessors to be the total taxable value of land and additions on the property. | Land | Improvement |
|---|---|---|---|---|
| 2025 | $3,017 | $358,300 | $115,000 | $243,300 |
| 2024 | $3,017 | $311,000 | $110,000 | $201,000 |
| 2023 | $2,903 | $293,200 | $105,000 | $188,200 |
| 2022 | $2,441 | $246,600 | $95,000 | $151,600 |
| 2021 | $2,145 | $216,700 | $85,000 | $131,700 |
| 2020 | $2,126 | $208,900 | $85,000 | $123,900 |
| 2019 | $2,021 | $196,500 | $78,000 | $118,500 |
| 2018 | $1,970 | $196,500 | $78,000 | $118,500 |
| 2017 | $1,940 | $193,500 | $75,000 | $118,500 |
| 2016 | $1,876 | $189,500 | $71,000 | $118,500 |
| 2015 | $1,823 | $184,100 | $71,000 | $113,100 |
| 2014 | $1,781 | $188,300 | $88,200 | $100,100 |
Source: Public Records
Map
Nearby Homes
- 3540 Dandelion Crescent
- 3721 Northwood Ct
- 3529 Plum Crescent
- 1338 Sierra Dr
- 1368 Sierra Dr
- 1392 Sierra Dr
- 1384 Sierra Dr
- 3403 Dandelion Crescent
- 3429 Plum Crescent
- 3684 Windmill Dr
- 1205 Geranium Crescent
- 1236 Ginger Crescent
- 3544 Campion Ave
- 3707 Sylvan Ln
- 3416 Crimson Holly Ct
- 1457 Ski Lodge Rd
- 3309 Weeping Willow Ln
- 3849 Sweetbriar Ct
- 1201 Green Cedar Ln
- 3756 Purebred Dr
- 3508 Dandelion Crescent
- 3520 Dandelion Crescent
- 3504 Dandelion Crescent
- 3517 Dandelion Crescent
- 3513 Dandelion Crescent
- 3521 Dandelion Crescent
- 3524 Dandelion Crescent
- 3500 Dandelion Crescent
- 3525 Dandelion Crescent
- 3505 Dandelion Crescent
- 3528 Dandelion Crescent
- 3529 Dandelion Crescent
- 3516 Daffodil Crescent
- 3520 Daffodil Crescent
- 3512 Daffodil Crescent
- 3504 Alister Ct
- 3532 Dandelion Crescent
- 3501 Dandelion Crescent
- 3508 Alister Ct
- 3508 Daffodil Crescent