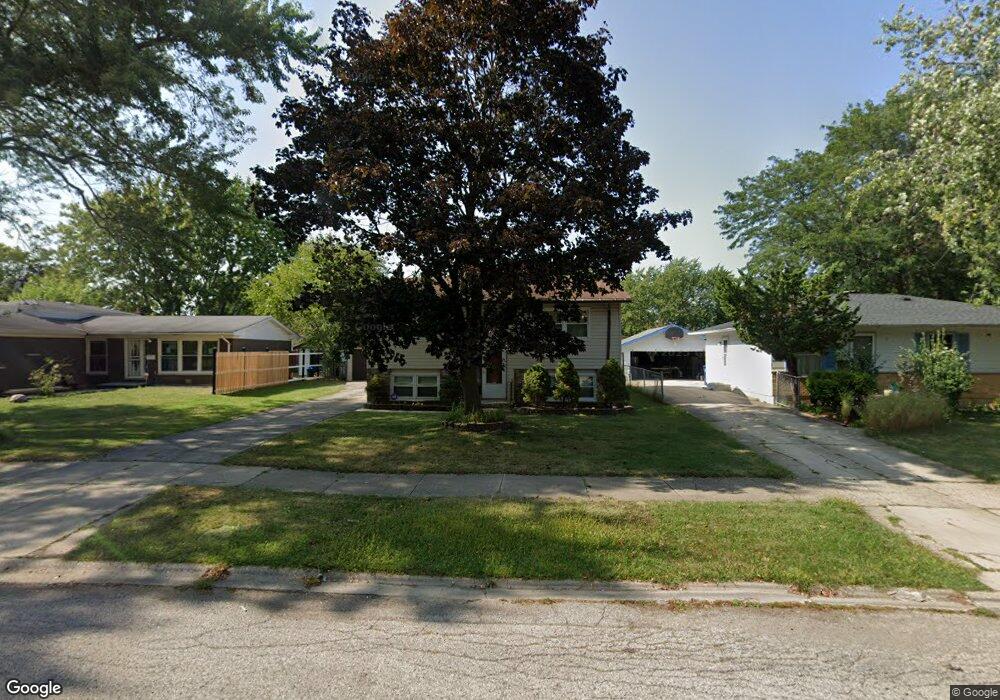
3512 Lorene Ct Waukegan, IL 60087
Estimated Value: $231,000 - $260,000
4
Beds
2
Baths
784
Sq Ft
$315/Sq Ft
Est. Value
About This Home
This home is located at 3512 Lorene Ct, Waukegan, IL 60087 and is currently estimated at $246,838, approximately $314 per square foot. 3512 Lorene Ct is a home located in Lake County with nearby schools including H R McCall Elementary School, Jack Benny Middle School, and Waukegan High School.
Ownership History
Date
Name
Owned For
Owner Type
Purchase Details
Closed on
Oct 25, 2011
Sold by
Federal Home Loan Mortgage Corporation
Bought by
Farias Frank and Horvath Maria
Current Estimated Value
Purchase Details
Closed on
May 12, 2011
Sold by
Jaramillo Juan C and Jaramillo Olga
Bought by
Federal Home Loan Mortgage Corp
Purchase Details
Closed on
Dec 2, 2003
Sold by
Zeifert Gregg K and Zeifert Eileen M D
Bought by
Jaramillo Juan C
Home Financials for this Owner
Home Financials are based on the most recent Mortgage that was taken out on this home.
Original Mortgage
$119,920
Interest Rate
8.25%
Mortgage Type
Purchase Money Mortgage
Create a Home Valuation Report for This Property
The Home Valuation Report is an in-depth analysis detailing your home's value as well as a comparison with similar homes in the area
Home Values in the Area
Average Home Value in this Area
Purchase History
| Date | Buyer | Sale Price | Title Company |
|---|---|---|---|
| Farias Frank | $53,000 | First American Title | |
| Federal Home Loan Mortgage Corp | -- | None Available | |
| Jaramillo Juan C | $150,000 | Chicago Title Insurance Comp |
Source: Public Records
Mortgage History
| Date | Status | Borrower | Loan Amount |
|---|---|---|---|
| Previous Owner | Jaramillo Juan C | $119,920 | |
| Closed | Jaramillo Juan C | $29,980 |
Source: Public Records
Tax History Compared to Growth
Tax History
| Year | Tax Paid | Tax Assessment Tax Assessment Total Assessment is a certain percentage of the fair market value that is determined by local assessors to be the total taxable value of land and additions on the property. | Land | Improvement |
|---|---|---|---|---|
| 2024 | $4,790 | $64,412 | $6,421 | $57,991 |
| 2023 | $4,012 | $59,382 | $6,198 | $53,184 |
| 2022 | $4,012 | $47,538 | $6,056 | $41,482 |
| 2021 | $4,151 | $46,329 | $5,902 | $40,427 |
| 2020 | $4,272 | $44,211 | $5,632 | $38,579 |
| 2019 | $4,421 | $41,945 | $5,343 | $36,602 |
| 2018 | $3,818 | $35,220 | $6,368 | $28,852 |
| 2017 | $3,795 | $33,133 | $5,991 | $27,142 |
| 2016 | $3,875 | $31,544 | $5,704 | $25,840 |
| 2015 | $3,801 | $28,929 | $5,231 | $23,698 |
| 2014 | $4,474 | $33,909 | $9,134 | $24,775 |
| 2012 | $5,181 | $35,238 | $9,492 | $25,746 |
Source: Public Records
Map
Nearby Homes
- 3411 N Lewis Ave
- 3211 Rugby Ct
- 37966 N Cornell Rd
- 1730 W Beach Rd
- 3101 Country Club Ln
- 38683 N Lewis Ave
- 12582 W Beach Rd
- 38127 N Shore Ave
- 1636 Rice St
- 38362 N Manor Ave
- 11345 W Carnahan Ave
- 38697 N Cedar Ave
- 11342-11364 W Wadsworth Rd
- 37905 N Loyola Ave
- 38859 N Green Bay Rd
- 1612 Whitney St
- 12312 W Audrey Ave
- 2613 N Lewis Ave
- 12640 W Wadsworth Rd
- 39113 N Green Bay Rd
- 3516 Lorene Ct
- 3508 Lorene Ct
- 3520 Newcastle Rd
- 3504 Lorene Ct
- 3517 Winhaven Dr
- 3521 Winhaven Dr
- 3513 Winhaven Dr
- 3525 Winhaven Dr
- 3445 Lorene Ct
- 3439 Lorene Ct
- 3500 Lorene Ct
- 3509 Winhaven Dr
- 3526 Newcastle Rd
- 3435 Lorene Ct
- 3535 Winhaven Dr
- 3505 Winhaven Dr
- 3438 Lorene Ct
- 3440 Newcastle Rd
- 3431 Lorene Ct
- 3509 Newcastle Rd