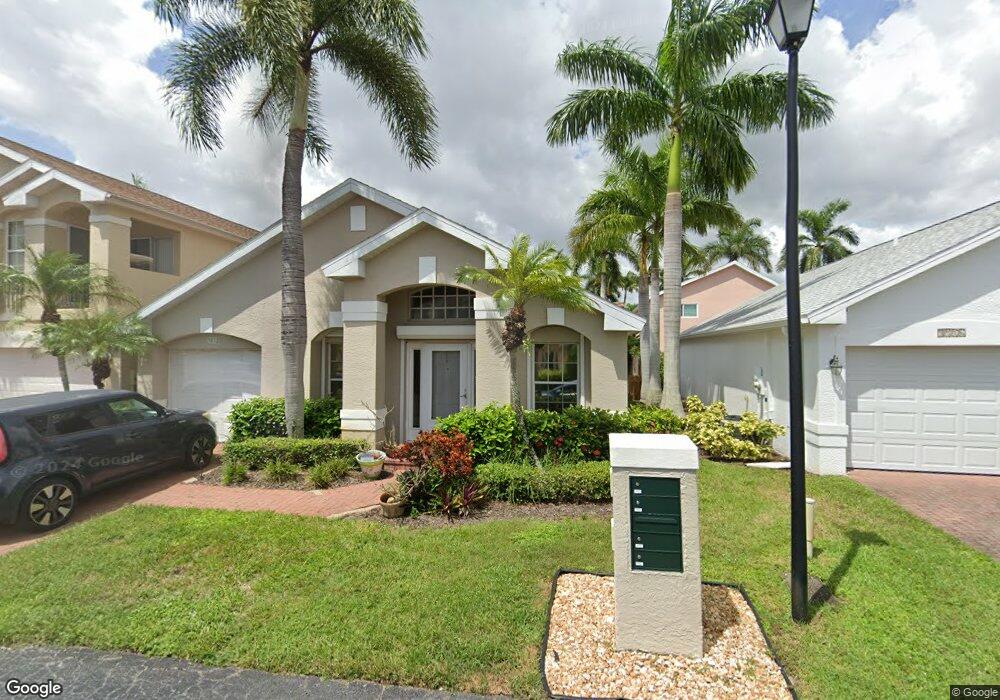
3512 Magenta Ct Unit 16 Naples, FL 34112
East Naples NeighborhoodEstimated Value: $313,000 - $416,000
--
Bed
--
Bath
1,320
Sq Ft
$283/Sq Ft
Est. Value
About This Home
This home is located at 3512 Magenta Ct Unit 16, Naples, FL 34112 and is currently estimated at $372,968, approximately $282 per square foot. 3512 Magenta Ct Unit 16 is a home located in Collier County with nearby schools including Lely Elementary School, East Naples Middle School, and Lely High School.
Ownership History
Date
Name
Owned For
Owner Type
Purchase Details
Closed on
Dec 2, 2016
Sold by
Ertzgaard Nancy Ann
Bought by
Ertzgaard Barry Lee and Ertzgaard Nancy Ann
Current Estimated Value
Purchase Details
Closed on
May 2, 2001
Sold by
Cox Joe B and Shepard Alicia R
Bought by
Ertzgaard Robert J
Home Financials for this Owner
Home Financials are based on the most recent Mortgage that was taken out on this home.
Original Mortgage
$100,800
Outstanding Balance
$37,499
Interest Rate
6.98%
Estimated Equity
$335,469
Purchase Details
Closed on
Apr 14, 2001
Sold by
Bartholomew Tracey L and Shepard Tracey Lee
Bought by
Ertzgaard Robert J
Home Financials for this Owner
Home Financials are based on the most recent Mortgage that was taken out on this home.
Original Mortgage
$100,800
Outstanding Balance
$37,499
Interest Rate
6.98%
Estimated Equity
$335,469
Purchase Details
Closed on
Jun 10, 1997
Sold by
Bougain Villas Inc
Bought by
Shepard Alicia R
Create a Home Valuation Report for This Property
The Home Valuation Report is an in-depth analysis detailing your home's value as well as a comparison with similar homes in the area
Home Values in the Area
Average Home Value in this Area
Purchase History
| Date | Buyer | Sale Price | Title Company |
|---|---|---|---|
| Ertzgaard Barry Lee | -- | None Available | |
| Ertzgaard Robert J | $126,000 | -- | |
| Ertzgaard Robert J | -- | -- | |
| Shepard Alicia R | $115,300 | -- |
Source: Public Records
Mortgage History
| Date | Status | Borrower | Loan Amount |
|---|---|---|---|
| Open | Ertzgaard Robert J | $100,800 | |
| Closed | Ertzgaard Robert J | $100,800 |
Source: Public Records
Tax History Compared to Growth
Tax History
| Year | Tax Paid | Tax Assessment Tax Assessment Total Assessment is a certain percentage of the fair market value that is determined by local assessors to be the total taxable value of land and additions on the property. | Land | Improvement |
|---|---|---|---|---|
| 2025 | $2,076 | $224,684 | -- | -- |
| 2024 | $2,044 | $218,352 | -- | -- |
| 2023 | $2,044 | $211,992 | $0 | $0 |
| 2022 | $2,069 | $205,817 | $0 | $0 |
| 2021 | $2,079 | $199,822 | $0 | $0 |
| 2020 | $2,031 | $197,063 | $0 | $0 |
| 2019 | $1,990 | $192,632 | $0 | $0 |
| 2018 | $1,942 | $189,040 | $0 | $189,040 |
| 2017 | $1,609 | $160,062 | $0 | $0 |
| 2016 | $1,562 | $156,770 | $0 | $0 |
| 2015 | $1,348 | $155,680 | $0 | $0 |
| 2014 | $1,650 | $122,320 | $0 | $0 |
Source: Public Records
Map
Nearby Homes
- 3516 Magenta Ct Unit 15
- 3508 Magenta Ct Unit 17
- 4261 Shetland Ct Unit 102
- 3579 Kent Dr
- 4897 Berkeley Dr
- 3719 Kent Dr
- 2056 Pine Isle Ln Unit 2056
- 1006 Pine Isle Ln Unit 1006
- 1014 Pine Isle Ln Unit 1014
- 2066 Pine Isle Ln Unit 2066
- 3626 Kent Dr
- 135 Blue Ridge Dr Unit 35
- 3127 Boca Ciega Dr Unit B-6
- 3143 Boca Ciega Dr Unit B4
- 212 Potomac Place Unit 51
- 3504 Magenta Ct Unit 18
- 3511 Magenta Ct Unit 8
- 3503 Magenta Ct Unit 6
- 3507 Magenta Ct Unit 7
- 3516 Magenta Ct
- 3515 Magenta Ct
- 3501 Magenta Ct
- 3523 Magenta Ct Unit 11
- 3690 Weymouth Cir Unit 1
- 3690 Weymouth Cir
- 3281 Duchess Dr
- 3273 Duchess Dr
- 3289 Duchess Dr
- 3527 Magenta Ct Unit 12
- 3562 Kent Dr Unit 10
- 3562 Kent Dr
- 3558 Kent Dr Unit 5
- 3720 Weymouth Cir Unit 4
- 3710 Weymouth Cir
- 3695 Weymouth Cir