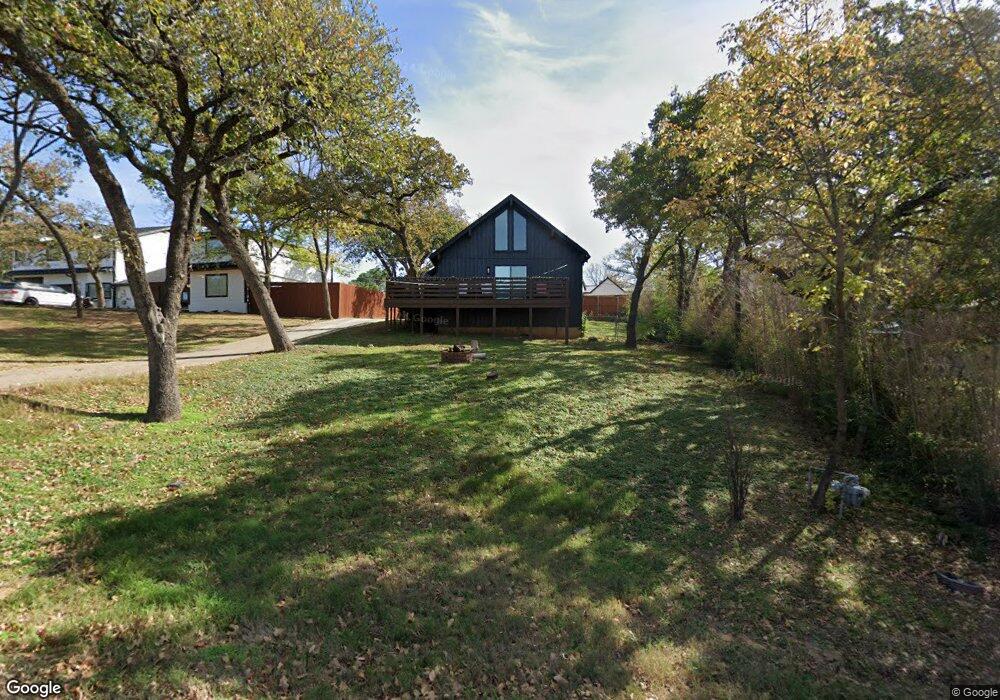
3512 Red Bird Ln Grapevine, TX 76051
Estimated Value: $312,932 - $614,000
2
Beds
1
Bath
1,130
Sq Ft
$373/Sq Ft
Est. Value
About This Home
This home is located at 3512 Red Bird Ln, Grapevine, TX 76051 and is currently estimated at $421,983, approximately $373 per square foot. 3512 Red Bird Ln is a home located in Tarrant County with nearby schools including Dove Elementary School, Grapevine Middle, and Grapevine High School.
Ownership History
Date
Name
Owned For
Owner Type
Purchase Details
Closed on
Mar 28, 2022
Sold by
Rudolf Fernandez Jason
Bought by
Jrf Holdings Llc
Current Estimated Value
Purchase Details
Closed on
May 26, 2009
Sold by
Fernandez Cristina Reyna
Bought by
Fernandez Jason Rudolf
Home Financials for this Owner
Home Financials are based on the most recent Mortgage that was taken out on this home.
Original Mortgage
$100,600
Interest Rate
4.76%
Mortgage Type
New Conventional
Purchase Details
Closed on
May 23, 2008
Sold by
Horne Terry
Bought by
Fernandez Jason and Fernandez Cristina
Home Financials for this Owner
Home Financials are based on the most recent Mortgage that was taken out on this home.
Original Mortgage
$100,000
Interest Rate
5.89%
Mortgage Type
Purchase Money Mortgage
Create a Home Valuation Report for This Property
The Home Valuation Report is an in-depth analysis detailing your home's value as well as a comparison with similar homes in the area
Home Values in the Area
Average Home Value in this Area
Purchase History
| Date | Buyer | Sale Price | Title Company |
|---|---|---|---|
| Jrf Holdings Llc | -- | None Listed On Document | |
| Fernandez Jason Rudolf | -- | Ult | |
| Fernandez Jason | -- | None Available |
Source: Public Records
Mortgage History
| Date | Status | Borrower | Loan Amount |
|---|---|---|---|
| Previous Owner | Fernandez Jason Rudolf | $100,600 | |
| Previous Owner | Fernandez Jason | $100,000 |
Source: Public Records
Tax History
| Year | Tax Paid | Tax Assessment Tax Assessment Total Assessment is a certain percentage of the fair market value that is determined by local assessors to be the total taxable value of land and additions on the property. | Land | Improvement |
|---|---|---|---|---|
| 2025 | $1,407 | $277,072 | $116,388 | $160,684 |
| 2024 | $1,407 | $291,655 | $116,388 | $175,267 |
| 2023 | $5,024 | $299,702 | $116,388 | $183,314 |
| 2022 | $4,671 | $235,777 | $116,388 | $119,389 |
| 2021 | $5,127 | $235,777 | $100,000 | $135,777 |
| 2020 | $4,141 | $188,267 | $100,000 | $88,267 |
| 2019 | $4,293 | $188,267 | $85,000 | $103,267 |
| 2018 | $1,017 | $171,001 | $55,000 | $116,001 |
| 2017 | $3,656 | $158,085 | $55,000 | $103,085 |
| 2016 | $3,238 | $140,020 | $55,000 | $85,020 |
| 2015 | $1,819 | $79,300 | $45,000 | $34,300 |
| 2014 | $1,819 | $79,300 | $45,000 | $34,300 |
Source: Public Records
Map
Nearby Homes
- 3538 Mercury Dr
- 2619 Peninsula Dr
- 3422 Mercury Dr
- 2936 Peninsula Dr
- 2523 Anglers Dr
- 3216 Mercury Dr
- 2821 Dove Pond Dr
- 2326 Forest Hills Rd
- 2966 Peninsula Dr
- 2900 W Kimball Ave
- 2912 Robindale Ln
- 3419 Lakeridge Dr
- 2954 Trail Lake Dr
- 2924 Scenic Dr
- 2800 Springbranch Ct
- 2716 Pin Oak Dr
- 2718 Hidden Lake Dr
- 2716 Summer Wind Dr
- 2807 Stonehurst Dr
- 3329 Boggett Ct
- 3504 Red Bird Ln
- 3518 Red Bird Ln
- 3428 Red Bird Ln
- 3564 Mercury Dr
- 3560 Mercury Dr
- 3509 Red Bird Ln
- 3503 Red Bird Ln
- 3574 Mercury Dr
- 3422 Red Bird Ln
- 3421 Red Bird Ln
- 3525 Red Bird Ln
- 3532 Red Bird Ln
- 3417 Red Bird Ln
- 3551 Mercury Dr
- 3546 Red Bird Ln
- 3548 Mercury Dr
- 2801 Trumarc Dr
- 3581 Mercury Dr
- 2807 Trumarc Dr
- 3600 Labrador Bay
Your Personal Tour Guide
Ask me questions while you tour the home.