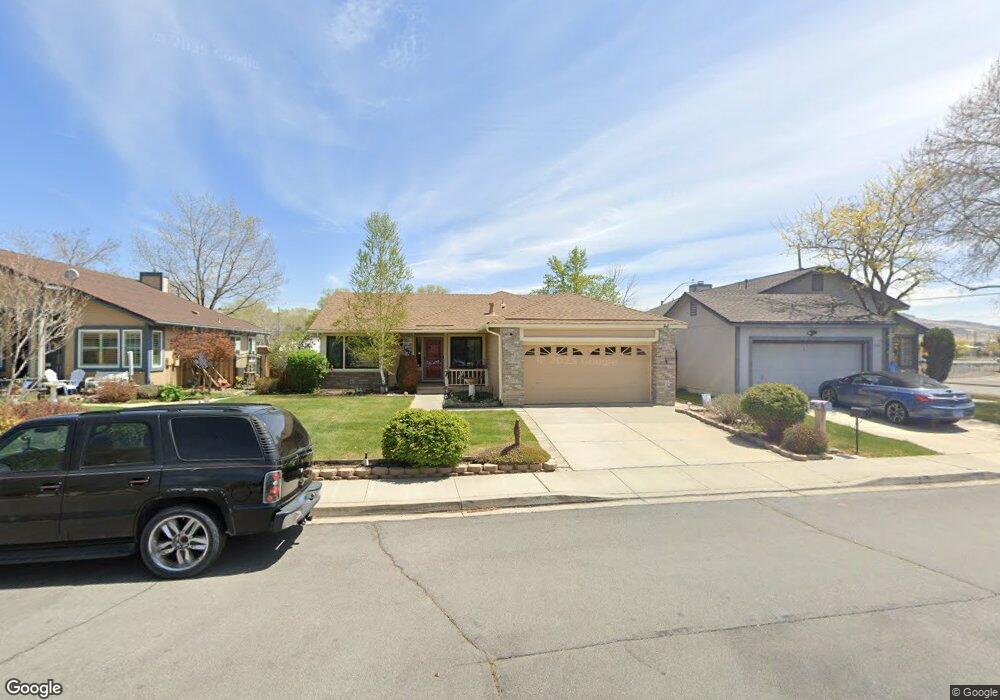
3512 Sunnybrook Ct Sparks, NV 89436
Reed NeighborhoodEstimated Value: $457,276 - $492,000
3
Beds
2
Baths
1,470
Sq Ft
$327/Sq Ft
Est. Value
About This Home
This home is located at 3512 Sunnybrook Ct, Sparks, NV 89436 and is currently estimated at $480,069, approximately $326 per square foot. 3512 Sunnybrook Ct is a home located in Washoe County with nearby schools including Lena Juniper Elementary School, Lou Mendive Middle School, and Edward C Reed High School.
Ownership History
Date
Name
Owned For
Owner Type
Purchase Details
Closed on
Oct 24, 2011
Sold by
Mitchell Blair W
Bought by
Mcmillan Burt E and Mcmillan Patricia A
Current Estimated Value
Home Financials for this Owner
Home Financials are based on the most recent Mortgage that was taken out on this home.
Original Mortgage
$140,750
Outstanding Balance
$95,579
Interest Rate
4.01%
Mortgage Type
VA
Estimated Equity
$384,490
Purchase Details
Closed on
Dec 13, 2001
Sold by
Boot Dorothy M
Bought by
Boot Dorothy M and 2001 Dorothy M Boot Family Trust
Create a Home Valuation Report for This Property
The Home Valuation Report is an in-depth analysis detailing your home's value as well as a comparison with similar homes in the area
Home Values in the Area
Average Home Value in this Area
Purchase History
| Date | Buyer | Sale Price | Title Company |
|---|---|---|---|
| Mcmillan Burt E | $138,000 | Western Title Company | |
| Boot Dorothy M | -- | -- |
Source: Public Records
Mortgage History
| Date | Status | Borrower | Loan Amount |
|---|---|---|---|
| Open | Mcmillan Burt E | $140,750 |
Source: Public Records
Tax History Compared to Growth
Tax History
| Year | Tax Paid | Tax Assessment Tax Assessment Total Assessment is a certain percentage of the fair market value that is determined by local assessors to be the total taxable value of land and additions on the property. | Land | Improvement |
|---|---|---|---|---|
| 2025 | $1,982 | $77,847 | $34,314 | $43,533 |
| 2024 | $1,982 | $75,722 | $31,554 | $44,168 |
| 2023 | $1,924 | $75,584 | $33,416 | $42,168 |
| 2022 | $1,870 | $60,811 | $25,403 | $35,408 |
| 2021 | $1,816 | $56,119 | $20,648 | $35,471 |
| 2020 | $1,761 | $55,445 | $19,684 | $35,761 |
| 2019 | $1,710 | $54,561 | $19,684 | $34,877 |
| 2018 | $1,659 | $48,070 | $13,732 | $34,338 |
| 2017 | $1,613 | $47,630 | $13,034 | $34,596 |
| 2016 | $1,570 | $47,053 | $11,638 | $35,415 |
| 2015 | $1,569 | $45,455 | $9,809 | $35,646 |
| 2014 | $1,523 | $43,079 | $8,579 | $34,500 |
| 2013 | -- | $40,734 | $6,517 | $34,217 |
Source: Public Records
Map
Nearby Homes
- 3602 Oakridge Dr
- 1031 Vintage Hills Pkwy
- 1069 Palmwood Dr
- 930 Spanish Springs Rd
- 1035 Baywood Dr Unit D
- 3988 Ella Jayne Ct Unit Lot 6
- 1029 Baywood Dr Unit D
- 3345 Groom Way
- Plan 4 at Eagle Peak
- Plan 5 at Eagle Peak
- Plan 2 at Eagle Peak
- Plan 1 at Eagle Peak
- Plan 3 at Eagle Peak
- 1128 Bradley Square
- 3200 Bristle Branch Dr
- 3198 Bristle Branch Dr
- 3188 Bristle Branch Dr
- 1575 Olinghouse St
- 3167 Bristle Branch Dr
- 1095 E York Way
- 3522 Sunnybrook Ct
- 3502 Sunnybrook Ct
- 3532 Sunnybrook Ct
- 1025 Sunnybrook Ln
- 3542 Sunnybrook Ct
- 1022 Sunnybrook Ln
- 2403 Pinewood Dr
- 2503 Pinewood Dr
- 1015 Sunnybrook Ln
- 2603 Pinewood Dr
- 1012 Sunnybrook Ln
- 2303 Pinewood Dr
- 3552 Sunnybrook Ct
- 3545 Sunnybrook Ct
- 1005 Sunnybrook Ln
- 2703 Pinewood Dr
- 3555 Sunnybrook Ct
- 3562 Sunnybrook Ct
- 2203 Pinewood Dr
- 2803 Pinewood Dr Unit 4