3512 Unique Way Las Vegas, NV 89129
Lone Mountain NeighborhoodEstimated Value: $457,857 - $476,000
4
Beds
3
Baths
2,030
Sq Ft
$229/Sq Ft
Est. Value
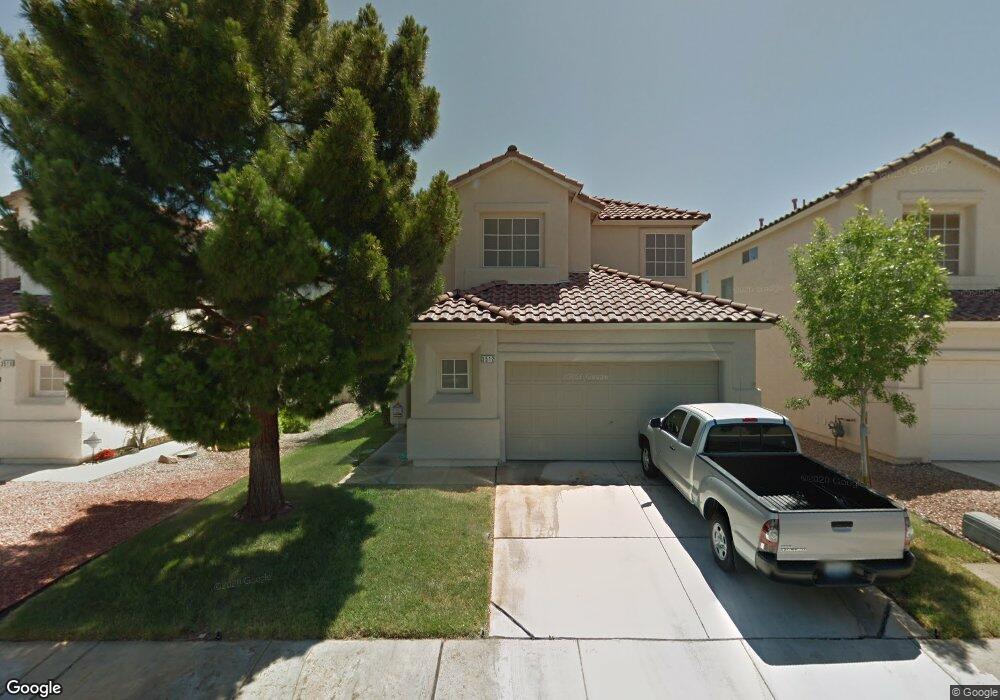
About This Home
This home is located at 3512 Unique Way, Las Vegas, NV 89129 and is currently estimated at $465,214, approximately $229 per square foot. 3512 Unique Way is a home located in Clark County with nearby schools including Dorothy Eisenberg Elementary School, Marc Kahre Elementary School, and Irwin & Susan Molasky Junior High School.
Ownership History
Date
Name
Owned For
Owner Type
Purchase Details
Closed on
Jun 3, 2020
Sold by
Napolitani Connie and Napolitani Concetta
Bought by
Napolitani Concetta and Cheta Living Trust
Current Estimated Value
Purchase Details
Closed on
Jul 17, 1998
Sold by
Napolitani Vincent R and Napolitani Connie
Bought by
Napolitani Vincent R and Napolitani Connie
Home Financials for this Owner
Home Financials are based on the most recent Mortgage that was taken out on this home.
Original Mortgage
$123,950
Outstanding Balance
$25,388
Interest Rate
7.01%
Estimated Equity
$439,826
Purchase Details
Closed on
May 19, 1995
Sold by
Trophy Ii At Foxfire Ranch Ltd Prtnrshp
Bought by
Napolitani Vincent R and Napolitani Connie
Home Financials for this Owner
Home Financials are based on the most recent Mortgage that was taken out on this home.
Original Mortgage
$122,393
Interest Rate
8.51%
Create a Home Valuation Report for This Property
The Home Valuation Report is an in-depth analysis detailing your home's value as well as a comparison with similar homes in the area
Home Values in the Area
Average Home Value in this Area
Purchase History
| Date | Buyer | Sale Price | Title Company |
|---|---|---|---|
| Napolitani Concetta | -- | None Available | |
| Napolitani Vincent R | -- | Land Title | |
| Napolitani Vincent R | $133,000 | United Title |
Source: Public Records
Mortgage History
| Date | Status | Borrower | Loan Amount |
|---|---|---|---|
| Open | Napolitani Vincent R | $123,950 | |
| Closed | Napolitani Vincent R | $122,393 |
Source: Public Records
Tax History Compared to Growth
Tax History
| Year | Tax Paid | Tax Assessment Tax Assessment Total Assessment is a certain percentage of the fair market value that is determined by local assessors to be the total taxable value of land and additions on the property. | Land | Improvement |
|---|---|---|---|---|
| 2025 | $1,781 | $97,689 | $35,700 | $61,989 |
| 2024 | $1,729 | $97,689 | $35,700 | $61,989 |
| 2023 | $1,729 | $89,922 | $30,800 | $59,122 |
| 2022 | $1,679 | $82,178 | $28,000 | $54,178 |
| 2021 | $1,630 | $75,181 | $23,450 | $51,731 |
| 2020 | $1,636 | $73,157 | $21,700 | $51,457 |
| 2019 | $1,534 | $71,331 | $20,650 | $50,681 |
| 2018 | $1,489 | $66,516 | $17,850 | $48,666 |
| 2017 | $2,090 | $63,764 | $14,350 | $49,414 |
| 2016 | $1,411 | $59,212 | $11,550 | $47,662 |
| 2015 | $1,407 | $51,368 | $10,150 | $41,218 |
| 2014 | $1,366 | $41,495 | $7,000 | $34,495 |
Source: Public Records
Map
Nearby Homes
- 3472 Unique Way
- 3560 Unique Way
- 3461 Quadrel St
- 3385 Wayward Ct
- 7633 Winterthur Ct
- 7460 Buckskin Ave
- 3473 Conough Ln Unit 5
- 7504 Grenfell Dr
- 3622 Mooncrest Cir
- 3352 Moon River St Unit 1
- 7609 Rory Ct
- 7429 Radville Dr
- 7424 Fort Wilkins Dr
- 7880 Ahey Rd
- 3758 Norton Dr
- 7800 Villa Finestra Dr
- 3890 Quadrel St
- 3685 Julius Ct
- 3125 N Buffalo Dr Unit 2104
- 3125 N Buffalo Dr Unit 2114
- 3508 Unique Way
- 3516 Unique Way
- 3504 Unique Way
- 3520 Unique Way
- 7601 Advantage Ct
- 7601 Advantage Ct Unit HOME
- 3524 Unique Way
- 3500 Unique Way
- 7612 W Delhi Ave
- 7605 Advantage Ct
- 3528 Unique Way
- 7600 Advantage Ct
- 7616 W Delhi Ave
- 7609 Advantage Ct
- 3532 Unique Way Unit n/a
- 3532 Unique Way
- 7604 Advantage Ct
- 7620 W Delhi Ave
- 7613 Advantage Ct