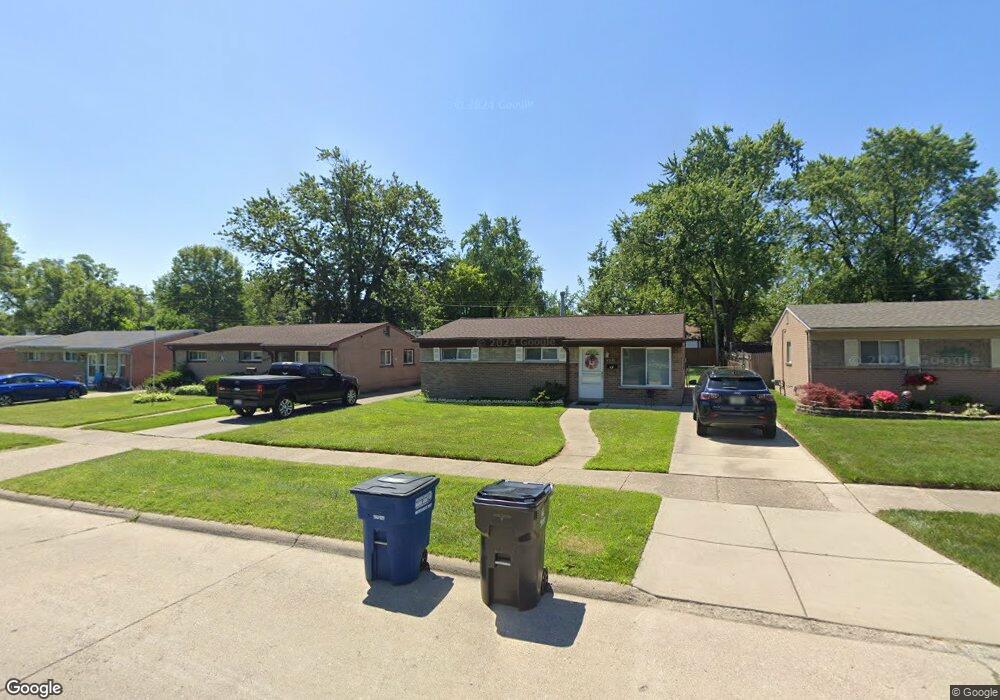
35121 Fairchild St Westland, MI 48186
Estimated Value: $168,982 - $192,000
3
Beds
1
Bath
1,022
Sq Ft
$172/Sq Ft
Est. Value
About This Home
This home is located at 35121 Fairchild St, Westland, MI 48186 and is currently estimated at $175,996, approximately $172 per square foot. 35121 Fairchild St is a home located in Wayne County with nearby schools including Alexander Hamilton Elementary School, Adams Middle School, and Benjamin Franklin Middle School.
Ownership History
Date
Name
Owned For
Owner Type
Purchase Details
Closed on
May 12, 2010
Sold by
Lee Karen
Bought by
Lee Karen and Karen Lee Revocable Living Tru
Current Estimated Value
Purchase Details
Closed on
Oct 22, 2009
Sold by
Legowsky Glen and Legowsky Kathleen
Bought by
Lee Karen
Home Financials for this Owner
Home Financials are based on the most recent Mortgage that was taken out on this home.
Original Mortgage
$55,962
Outstanding Balance
$36,598
Interest Rate
5.11%
Mortgage Type
FHA
Estimated Equity
$139,398
Purchase Details
Closed on
Aug 27, 2008
Sold by
Ellis Tammy and Ellis Tammy J
Bought by
The Bank Of New York Mellon Trust Co Na and Jpmorgan Chase Bank Na
Purchase Details
Closed on
Oct 24, 2001
Sold by
Birmingham Bambi L
Bought by
Ellis Tammy J
Home Financials for this Owner
Home Financials are based on the most recent Mortgage that was taken out on this home.
Original Mortgage
$104,621
Interest Rate
6.93%
Create a Home Valuation Report for This Property
The Home Valuation Report is an in-depth analysis detailing your home's value as well as a comparison with similar homes in the area
Home Values in the Area
Average Home Value in this Area
Purchase History
| Date | Buyer | Sale Price | Title Company |
|---|---|---|---|
| Lee Karen | -- | None Available | |
| Lee Karen | $57,000 | Capital Title Ins Agency | |
| The Bank Of New York Mellon Trust Co Na | $60,000 | None Available | |
| Ellis Tammy J | $108,500 | -- |
Source: Public Records
Mortgage History
| Date | Status | Borrower | Loan Amount |
|---|---|---|---|
| Open | Lee Karen | $55,962 | |
| Previous Owner | Ellis Tammy J | $104,621 |
Source: Public Records
Tax History Compared to Growth
Tax History
| Year | Tax Paid | Tax Assessment Tax Assessment Total Assessment is a certain percentage of the fair market value that is determined by local assessors to be the total taxable value of land and additions on the property. | Land | Improvement |
|---|---|---|---|---|
| 2025 | $1,395 | $68,300 | $0 | $0 |
| 2024 | $1,395 | $66,200 | $0 | $0 |
| 2023 | $1,332 | $59,400 | $0 | $0 |
| 2022 | $1,577 | $53,100 | $0 | $0 |
| 2021 | $1,538 | $50,800 | $0 | $0 |
| 2020 | $1,521 | $41,900 | $0 | $0 |
| 2019 | $1,466 | $38,000 | $0 | $0 |
| 2018 | $1,051 | $31,600 | $0 | $0 |
| 2017 | $547 | $31,100 | $0 | $0 |
| 2016 | $1,366 | $30,600 | $0 | $0 |
| 2015 | $2,601 | $29,090 | $0 | $0 |
| 2013 | $2,700 | $27,540 | $0 | $0 |
| 2012 | $1,495 | $30,120 | $0 | $0 |
Source: Public Records
Map
Nearby Homes
- 35236 Glen St
- 35193 Sansburn St
- 34465 Fairchild St
- 34553 Hazelwood St
- 1645 Regene St
- 1681 Stieber St
- 32730 Palmer Rd
- 1631 Ackley Ave
- 344 S Christine
- 34728 Somerset St
- 1811 S Harvey Ave
- 34114 Avondale St
- 357 S Dobson St
- 1909 S Christine
- 35608 Somerset St
- 1858 Stieber St Unit 5
- 366 S Wildwood St
- 36293 Monroe Ave
- 36034 Rolf St
- 35130 June Dr
- 35111 Fairchild St
- 35133 Fairchild St
- 35101 Fairchild St
- 35205 Fairchild St
- 35174 Glen St
- 35075 Fairchild St
- 35164 Glen St
- 35225 Fairchild St Unit Bldg-Unit
- 35215 Fairchild St
- 35225 Fairchild St
- 35190 Glen St
- 35156 Glen St
- 35120 Fairchild St
- 35110 Fairchild St
- 35136 Fairchild St
- 35065 Fairchild St
- 35144 Glen St
- 35100 Fairchild St
- 35226 Glen St
- 35076 Fairchild St