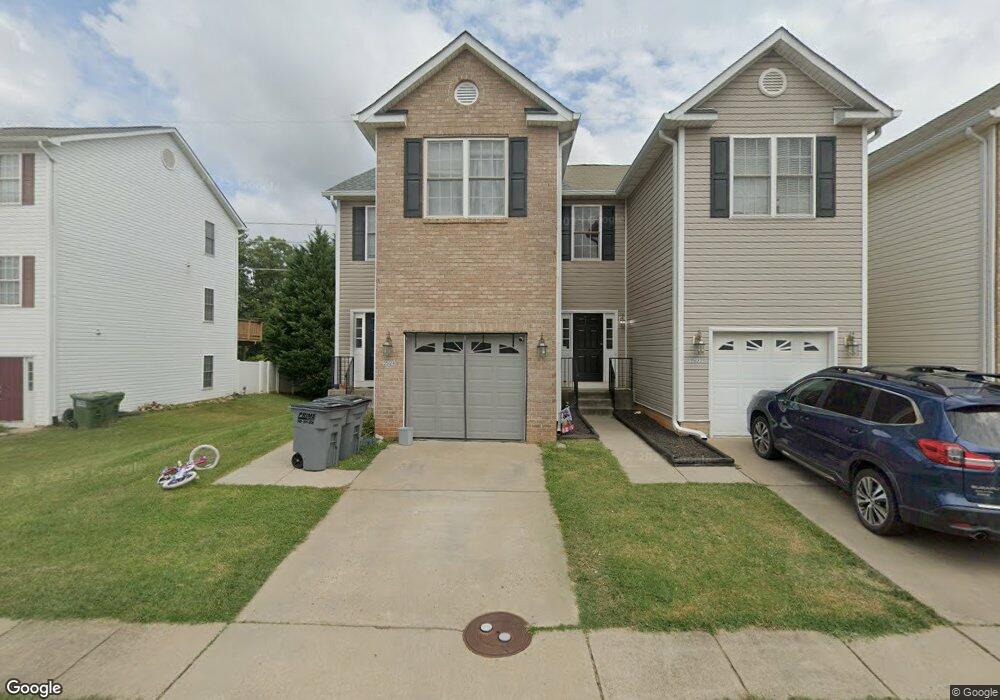
35124 Sara Ct Locust Grove, VA 22508
Estimated Value: $300,000 - $344,000
3
Beds
4
Baths
2,080
Sq Ft
$154/Sq Ft
Est. Value
About This Home
This home is located at 35124 Sara Ct, Locust Grove, VA 22508 and is currently estimated at $319,640, approximately $153 per square foot. 35124 Sara Ct is a home located in Orange County with nearby schools including Locust Grove Primary School, Locust Grove Elementary School, and Locust Grove Middle School.
Ownership History
Date
Name
Owned For
Owner Type
Purchase Details
Closed on
Nov 13, 2018
Sold by
Hoyt John A
Bought by
Williams Tiffany J and Smith Tory J
Current Estimated Value
Home Financials for this Owner
Home Financials are based on the most recent Mortgage that was taken out on this home.
Original Mortgage
$177,721
Outstanding Balance
$157,269
Interest Rate
5.12%
Mortgage Type
FHA
Estimated Equity
$162,371
Purchase Details
Closed on
Nov 22, 2010
Sold by
Fannie Mae
Bought by
Hoyt John A
Home Financials for this Owner
Home Financials are based on the most recent Mortgage that was taken out on this home.
Original Mortgage
$122,130
Interest Rate
4.23%
Mortgage Type
New Conventional
Purchase Details
Closed on
Jun 2, 2010
Sold by
James Dwight A
Bought by
Federal National Mortgage Association
Create a Home Valuation Report for This Property
The Home Valuation Report is an in-depth analysis detailing your home's value as well as a comparison with similar homes in the area
Home Values in the Area
Average Home Value in this Area
Purchase History
| Date | Buyer | Sale Price | Title Company |
|---|---|---|---|
| Williams Tiffany J | $181,000 | Terrys Title | |
| Hoyt John A | $118,000 | Title Solutions Inc | |
| Federal National Mortgage Association | $210,918 | None Available |
Source: Public Records
Mortgage History
| Date | Status | Borrower | Loan Amount |
|---|---|---|---|
| Open | Williams Tiffany J | $177,721 | |
| Previous Owner | Hoyt John A | $122,130 |
Source: Public Records
Tax History Compared to Growth
Tax History
| Year | Tax Paid | Tax Assessment Tax Assessment Total Assessment is a certain percentage of the fair market value that is determined by local assessors to be the total taxable value of land and additions on the property. | Land | Improvement |
|---|---|---|---|---|
| 2024 | $1,460 | $192,600 | $30,000 | $162,600 |
| 2023 | $1,460 | $192,600 | $30,000 | $162,600 |
| 2022 | $1,460 | $192,600 | $30,000 | $162,600 |
| 2021 | $1,401 | $194,600 | $30,000 | $164,600 |
| 2020 | $1,401 | $194,600 | $30,000 | $164,600 |
| 2019 | $1,345 | $167,300 | $25,000 | $142,300 |
| 2018 | $1,345 | $167,300 | $25,000 | $142,300 |
| 2017 | $1,345 | $167,300 | $25,000 | $142,300 |
| 2016 | $1,345 | $167,300 | $25,000 | $142,300 |
| 2015 | $907 | $126,000 | $25,000 | $101,000 |
| 2014 | $907 | $126,000 | $25,000 | $101,000 |
Source: Public Records
Map
Nearby Homes
- 35158 Sara Ct
- Barbados Isle with Basement Plan at Twin Lake Villas - Active Adult
- Caicos with Basement Plan at Twin Lake Villas - Active Adult
- Barbados Isle Plan at Twin Lake Villas - Active Adult
- 2324 Wildflower Way
- 35618 Pine Needle Ln
- 35619 Pine Needle Ln
- Coral Plan at Wilderness Shores - Seasons Collection
- Lapis Plan at Wilderness Shores - Seasons Collection
- Hemingway Plan at Wilderness Shores - Seasons Collection
- Alexandrite Plan at Wilderness Shores - Seasons Collection
- Coronado Plan at Wilderness Shores - Seasons Collection
- 2928 White Tail Dr
- 2845 White Tail Dr
- 35305 Wilderness Shores Way
- 35291 Gosling Ln
- 35595 Pine Needle Ln
- 35599 Pine Needle Ln
- 35603 Pine Needle Ln
- 35598 Pine Needle Ln