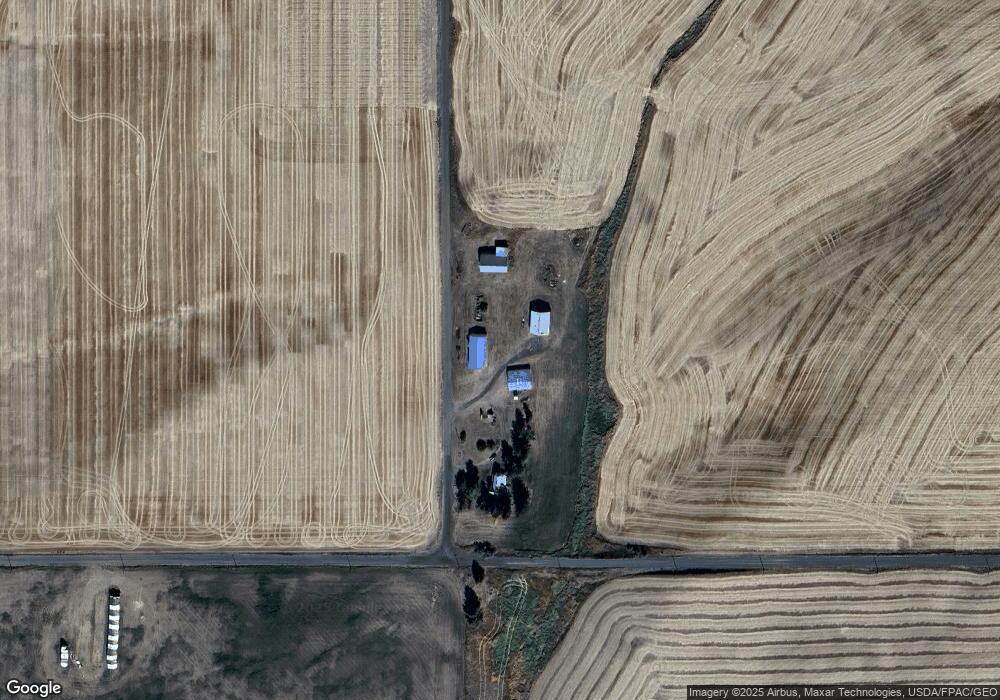
35127 S Chapman Rd Fairfield, WA 99012
Estimated Value: $525,000 - $827,000
4
Beds
1
Bath
2,308
Sq Ft
$300/Sq Ft
Est. Value
About This Home
This home is located at 35127 S Chapman Rd, Fairfield, WA 99012 and is currently estimated at $692,823, approximately $300 per square foot. 35127 S Chapman Rd is a home located in Spokane County with nearby schools including Liberty Elementary/Junior High School and Liberty High School.
Ownership History
Date
Name
Owned For
Owner Type
Purchase Details
Closed on
May 13, 2009
Sold by
Olson David
Bought by
Olson David and Olson Barbara L
Current Estimated Value
Purchase Details
Closed on
Mar 24, 2008
Sold by
Olson Farms Ltd
Bought by
Olson David
Purchase Details
Closed on
Jan 16, 1992
Sold by
Olson Luella R
Bought by
Olson Raymond C and Olson David L
Purchase Details
Closed on
Dec 18, 1991
Sold by
Olson Luella R
Bought by
Olson Raymond C and Olson David L
Purchase Details
Closed on
Jan 30, 1978
Sold by
Ruff Martin
Bought by
Ruff Martin
Purchase Details
Closed on
Aug 26, 1976
Sold by
Jonko Florence and Jonko Joseph
Bought by
Olson Farms Ltd
Purchase Details
Closed on
Aug 25, 1976
Sold by
Olson Luella and Olson Conrad
Bought by
Olson Farms Ltd
Purchase Details
Closed on
Aug 20, 1976
Sold by
Ruff Evelyn and Ruff Martin
Bought by
Olson Farms Ltd
Purchase Details
Closed on
Aug 19, 1976
Sold by
Ward Dorothy
Bought by
Olson Farms Ltd
Create a Home Valuation Report for This Property
The Home Valuation Report is an in-depth analysis detailing your home's value as well as a comparison with similar homes in the area
Home Values in the Area
Average Home Value in this Area
Purchase History
| Date | Buyer | Sale Price | Title Company |
|---|---|---|---|
| Olson David | -- | None Available | |
| Olson David | -- | None Available | |
| Olson Raymond C | -- | None Available | |
| Olson Raymond C | -- | None Available | |
| Ruff Martin | -- | Pioneer National Title Ins | |
| Olson Farms Ltd | -- | None Available | |
| Olson Farms Ltd | -- | None Available | |
| Olson Farms Ltd | -- | None Available | |
| Olson Farms Ltd | -- | None Available |
Source: Public Records
Tax History Compared to Growth
Tax History
| Year | Tax Paid | Tax Assessment Tax Assessment Total Assessment is a certain percentage of the fair market value that is determined by local assessors to be the total taxable value of land and additions on the property. | Land | Improvement |
|---|---|---|---|---|
| 2025 | $3,368 | $702,780 | $299,780 | $403,000 |
| 2024 | $3,368 | $678,980 | $299,780 | $379,200 |
| 2023 | $2,935 | $656,470 | $314,770 | $341,700 |
| 2022 | $3,184 | $648,970 | $314,770 | $334,200 |
| 2021 | $3,336 | $533,010 | $254,810 | $278,200 |
| 2020 | $3,267 | $480,430 | $224,830 | $255,600 |
| 2019 | $2,984 | $460,830 | $224,830 | $236,000 |
| 2018 | $3,473 | $412,170 | $179,870 | $232,300 |
| 2017 | $3,181 | $394,170 | $179,870 | $214,300 |
| 2016 | $2,724 | $376,470 | $179,870 | $196,600 |
| 2015 | $2,797 | $340,690 | $149,890 | $190,800 |
| 2014 | -- | $332,890 | $149,890 | $183,000 |
| 2013 | -- | $0 | $0 | $0 |
Source: Public Records
Map
Nearby Homes
- TBD E Steptoe View Ln
- 529 N Vine St
- 203 E Brewster St
- 412 W Carlton Ave
- 209 E Ticknor St
- 306 W Hamilton Ave
- 103 W Market St
- 307 Eastview Ln
- 206 S Main St Unit NKA S Main St
- 406 N Northridge Way
- 409 N 2nd St
- 11900 E Hays Rd Unit Lot A - Parcel 9030
- 25210 E Bradshaw Rd
- 19405 S Harvard Rd
- 19207 S Harvard Rd
- 38521 Tekoa Idaho Rd Unit 39204 Cove Rd
- NKA Merideth
- 6919 E Spangle Waverly Rd
- 1047 Merideth Rd
- XXXXX Vacant Land