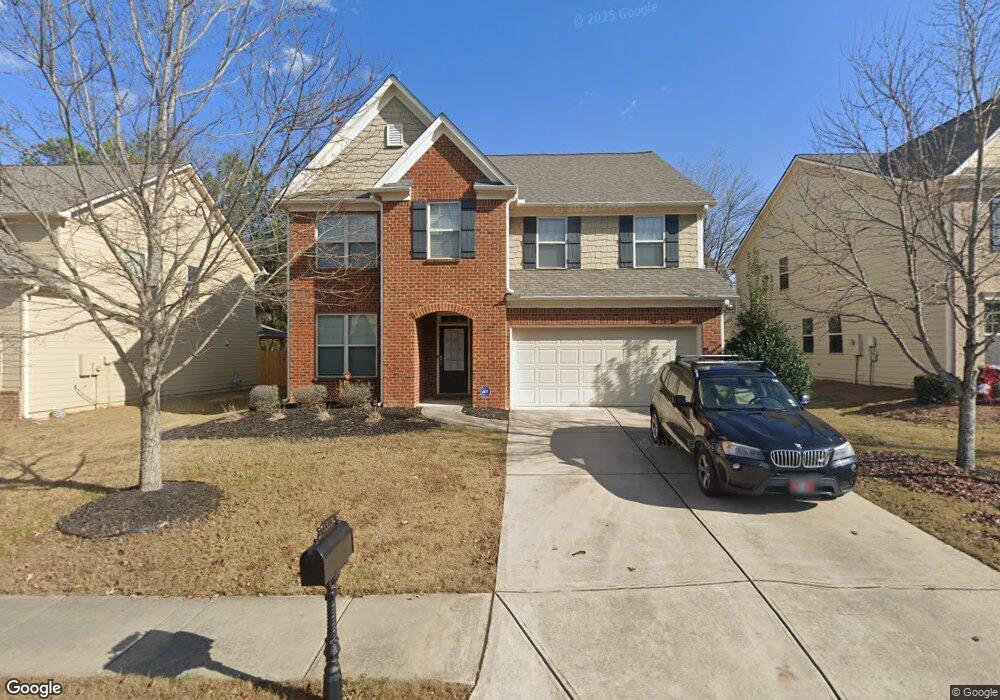
3513 Fallen Oak Dr Unit 2 Buford, GA 30519
Estimated Value: $450,000 - $513,000
5
Beds
3
Baths
2,989
Sq Ft
$164/Sq Ft
Est. Value
About This Home
This home is located at 3513 Fallen Oak Dr Unit 2, Buford, GA 30519 and is currently estimated at $489,831, approximately $163 per square foot. 3513 Fallen Oak Dr Unit 2 is a home located in Gwinnett County with nearby schools including Patrick Elementary School, Glenn C. Jones Middle School, and Sugar Hill Christian Academy.
Ownership History
Date
Name
Owned For
Owner Type
Purchase Details
Closed on
Apr 21, 2025
Sold by
Doan Ha Phuc
Bought by
Oak 3513 Ltd Liability Co
Current Estimated Value
Purchase Details
Closed on
May 1, 2024
Sold by
Yu Kuai
Bought by
Doan Ha Phuc and Nguyen Quang T
Purchase Details
Closed on
Mar 31, 2022
Sold by
Malcolm Alicia Melony
Bought by
Yu Kuai
Home Financials for this Owner
Home Financials are based on the most recent Mortgage that was taken out on this home.
Original Mortgage
$341,250
Interest Rate
3.76%
Mortgage Type
New Conventional
Purchase Details
Closed on
Oct 28, 2011
Sold by
Lennar Georgia Inc
Bought by
Malcolm Alicia Melony
Home Financials for this Owner
Home Financials are based on the most recent Mortgage that was taken out on this home.
Original Mortgage
$204,197
Interest Rate
4.09%
Mortgage Type
VA
Purchase Details
Closed on
Apr 20, 2011
Sold by
Gwinnett Cmnty Bk
Bought by
Lennar Ga Inc
Create a Home Valuation Report for This Property
The Home Valuation Report is an in-depth analysis detailing your home's value as well as a comparison with similar homes in the area
Home Values in the Area
Average Home Value in this Area
Purchase History
| Date | Buyer | Sale Price | Title Company |
|---|---|---|---|
| Oak 3513 Ltd Liability Co | -- | -- | |
| Oak 3513 Ltd Liability Co | -- | -- | |
| Doan Ha Phuc | $510,000 | -- | |
| Doan Ha Phuc | $510,000 | -- | |
| Yu Kuai | $480,000 | -- | |
| Yu Kuai | $480,000 | -- | |
| Malcolm Alicia Melony | $199,900 | -- | |
| Malcolm Alicia Melony | $199,900 | -- | |
| Lennar Ga Inc | $351,000 | -- | |
| Lennar Ga Inc | $351,000 | -- |
Source: Public Records
Mortgage History
| Date | Status | Borrower | Loan Amount |
|---|---|---|---|
| Previous Owner | Yu Kuai | $341,250 | |
| Previous Owner | Malcolm Alicia Melony | $204,197 |
Source: Public Records
Tax History
| Year | Tax Paid | Tax Assessment Tax Assessment Total Assessment is a certain percentage of the fair market value that is determined by local assessors to be the total taxable value of land and additions on the property. | Land | Improvement |
|---|---|---|---|---|
| 2025 | $7,822 | $213,120 | $40,000 | $173,120 |
| 2024 | $5,848 | $154,720 | $29,600 | $125,120 |
| 2023 | $5,848 | $154,720 | $29,600 | $125,120 |
| 2022 | $5,811 | $154,720 | $29,600 | $125,120 |
| 2021 | $4,886 | $126,640 | $24,560 | $102,080 |
| 2020 | $4,515 | $115,640 | $24,560 | $91,080 |
| 2019 | $4,349 | $115,640 | $24,560 | $91,080 |
| 2018 | $4,115 | $108,800 | $22,000 | $86,800 |
| 2016 | $3,436 | $89,480 | $17,200 | $72,280 |
| 2015 | $3,475 | $89,480 | $17,200 | $72,280 |
| 2014 | $3,495 | $89,480 | $17,200 | $72,280 |
Source: Public Records
Map
Nearby Homes
- 3503 Fallen Oak Dr
- 3534 Fallen Oak Ln
- 2287 Tortuga Pass
- 2190 Copper Trail Ln
- 2148 Splitrail Trail
- 2275 Copper Trail Ln
- 2249 White Alder Dr
- 2162 Mill Garden Run
- 1970 Sturbridge Ln Unit 1
- 2123 Mill Garden Run
- 3476 Harvest Ridge Ln
- 2140 Harvest Ridge Cir
- 3301 Wild Basil Ln
- 3267 Mill Springs Cir
- 3187 Mill Springs Cir
- 3263 Mill Springs Cir NE
- 3297 Mill Springs Cir
- 3056 Cedar Glade Ln
- 2395 Kilgore Rd
- 3160 Mill Springs Cir
- 3513 Fallen Oak Dr Unit .
- 3513 Fallen Oak Dr
- 3500 Cross Rd
- 3523 Fallen Oak Dr
- 3493 Fallen Oak Dr
- 3512 Fallen Oak Dr
- 3502 Fallen Oak Dr
- 0 Fallen Oak Dr Unit 8826001
- 3483 Fallen Oak Dr
- 3482 Fallen Oak Dr
- 3532 Fallen Oak Dr
- 3543 Fallen Oak Dr
- 3542 Fallen Oak Dr
- 3473 Fallen Oak Dr
- 3553 Fallen Oak Dr
- 3575 Fallen Oak Ln
- 3377 Cross Rd
- 3462 Fallen Oak Dr
- 3585 Fallen Oak Ln
- 3552 Fallen Oak Dr
Your Personal Tour Guide
Ask me questions while you tour the home.