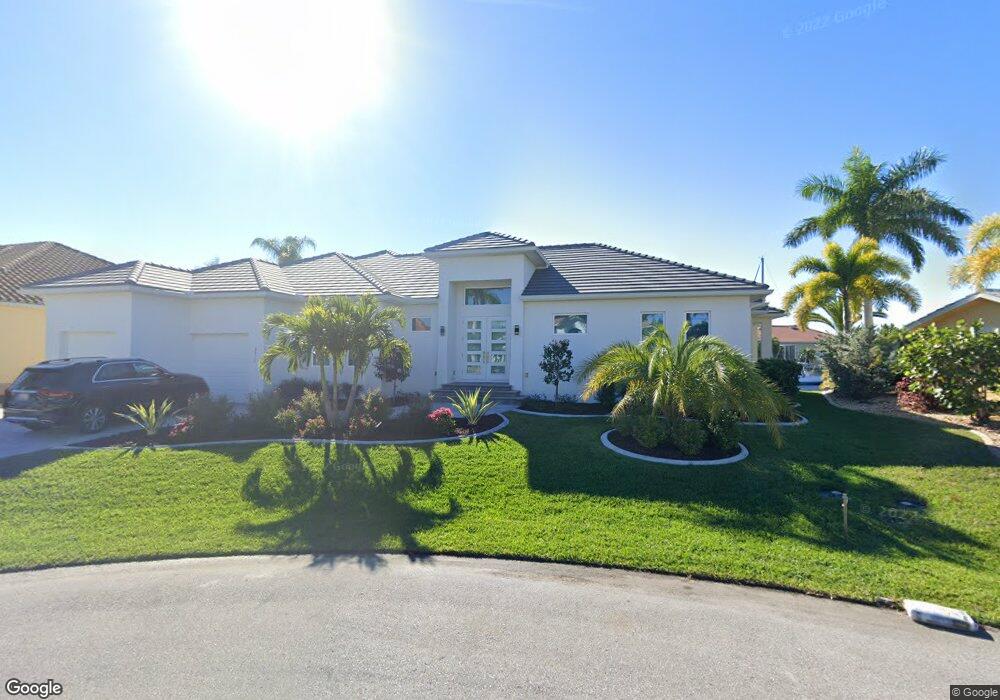
3513 Marsala Ct Punta Gorda, FL 33950
Burnt Store Isles NeighborhoodEstimated Value: $935,000 - $1,078,611
3
Beds
3
Baths
2,541
Sq Ft
$395/Sq Ft
Est. Value
About This Home
This home is located at 3513 Marsala Ct, Punta Gorda, FL 33950 and is currently estimated at $1,003,403, approximately $394 per square foot. 3513 Marsala Ct is a home located in Charlotte County with nearby schools including Sallie Jones Elementary School, Punta Gorda Middle School, and Charlotte High School.
Ownership History
Date
Name
Owned For
Owner Type
Purchase Details
Closed on
Jan 31, 2017
Sold by
Tinsley Hal M and Tinsley Melanie B
Bought by
Christensen Ole and Christensen Grethe
Current Estimated Value
Purchase Details
Closed on
Sep 17, 1999
Sold by
Sarisky Robert and Sarisky Teresa
Bought by
Tinsley Hal M and Tinsley Melanie B
Home Financials for this Owner
Home Financials are based on the most recent Mortgage that was taken out on this home.
Original Mortgage
$71,100
Interest Rate
8.22%
Mortgage Type
Purchase Money Mortgage
Purchase Details
Closed on
Sep 9, 1999
Sold by
Nationsbank N A
Bought by
Sarisky Robert and Sarisky Teresa
Home Financials for this Owner
Home Financials are based on the most recent Mortgage that was taken out on this home.
Original Mortgage
$71,100
Interest Rate
8.22%
Mortgage Type
Purchase Money Mortgage
Purchase Details
Closed on
Jun 1, 1993
Sold by
Citizen & Southern Bk Fl
Bought by
Sarisky Robert and Sarisky Teresa
Home Financials for this Owner
Home Financials are based on the most recent Mortgage that was taken out on this home.
Original Mortgage
$30,000
Interest Rate
7.45%
Mortgage Type
Purchase Money Mortgage
Create a Home Valuation Report for This Property
The Home Valuation Report is an in-depth analysis detailing your home's value as well as a comparison with similar homes in the area
Home Values in the Area
Average Home Value in this Area
Purchase History
| Date | Buyer | Sale Price | Title Company |
|---|---|---|---|
| Christensen Ole | $175,000 | Msc Title Inc | |
| Tinsley Hal M | $83,800 | -- | |
| Sarisky Robert | -- | -- | |
| Sarisky Robert | $50,000 | -- |
Source: Public Records
Mortgage History
| Date | Status | Borrower | Loan Amount |
|---|---|---|---|
| Previous Owner | Tinsley Hal M | $71,100 | |
| Previous Owner | Sarisky Robert | $30,000 |
Source: Public Records
Tax History Compared to Growth
Tax History
| Year | Tax Paid | Tax Assessment Tax Assessment Total Assessment is a certain percentage of the fair market value that is determined by local assessors to be the total taxable value of land and additions on the property. | Land | Improvement |
|---|---|---|---|---|
| 2025 | $15,066 | $894,112 | $267,750 | $626,362 |
| 2023 | $14,478 | $687,226 | $0 | $0 |
| 2022 | $13,152 | $862,785 | $236,300 | $626,485 |
| 2021 | $3,576 | $170,000 | $170,000 | $0 |
| 2020 | $3,408 | $170,000 | $170,000 | $0 |
| 2019 | $3,707 | $170,000 | $170,000 | $0 |
| 2018 | $3,540 | $165,750 | $165,750 | $0 |
| 2017 | $3,152 | $148,750 | $148,750 | $0 |
| 2016 | $2,960 | $128,974 | $0 | $0 |
| 2015 | $2,788 | $117,249 | $0 | $0 |
| 2014 | $2,451 | $106,590 | $0 | $0 |
Source: Public Records
Map
Nearby Homes
- 3500 Marsala Ct
- 3538 Saint Florent Ct
- 3507 Terin Ct
- 3518 Terin Ct
- 201 Singapore Rd
- 3513 Dileuca St
- 141 Singapore Rd
- 435 La Sila Ct
- 3500 Mondovi Ct Unit 1012
- 3500 Mondovi Ct Unit 212
- 3701 Baynard Dr Unit Lot H9
- 3701 Baynard Dr Unit Lot C12
- 3701 Baynard Dr Unit Lot J1
- 3701 Baynard Dr Unit Lot G29
- 3701 Baynard Dr Unit D1
- 3701 Baynard Dr Unit I-21
- 3701 Baynard Dr Unit Lot G27
- 3701 Baynard Dr Unit Lot I28
- 3701 Baynard Dr Unit Lot H24
- 3701 Baynard Dr Unit F-14
- 3500 Marsala Ct Punta Gorda Fl Ct
- 3500 Marsala Court Punta Gorda Fl Ct
- 3500 Marsala Court Punta Gorda Ct
- 3500 Marsala Ct Unit 109
- 3512 Court
- 3528 Tripoli Blvd
- 3512 Marsala Ct
- 3518 Marsala Ct
- 3506 Marsala Ct
- 3516 Tripoli Blvd
- 3532 Saint Florent Ct
- 3542 Tripoli Blvd
- 3524 Saint Florent Ct
- 3554 Tripoli Blvd
- 3512 Saint Florent Ct
- 3535 Tripoli Blvd
- 3549 Tripoli Blvd
- 3519 Tripoli Blvd
- 3513 Tripoli Blvd
- 3535 Saint Florent Ct