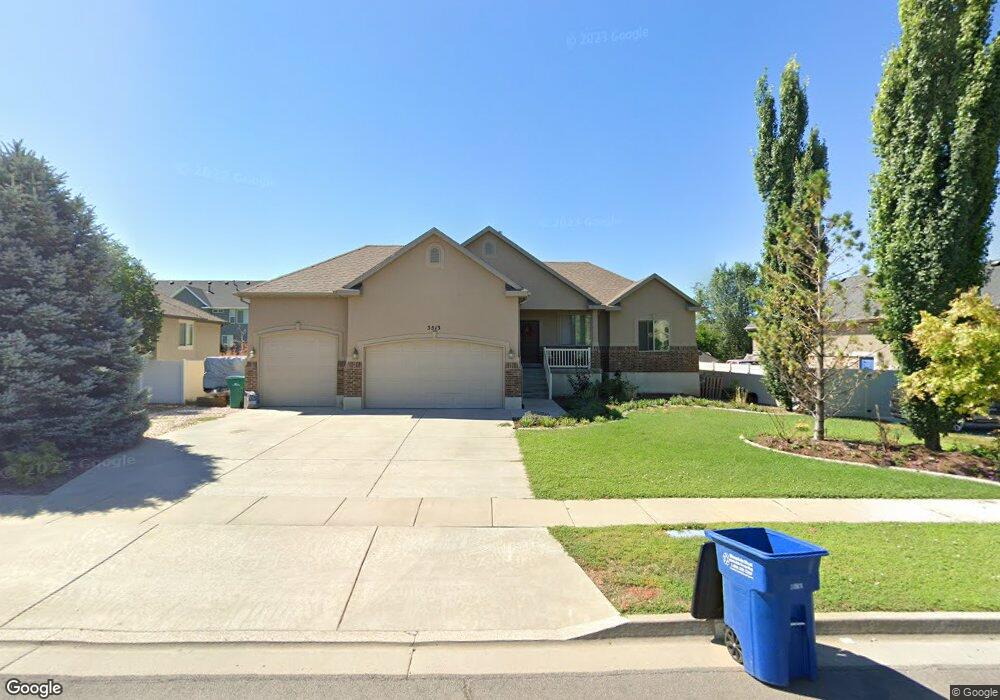
3513 W 400 N Layton, UT 84041
Estimated Value: $543,000 - $612,064
3
Beds
2
Baths
2,858
Sq Ft
$203/Sq Ft
Est. Value
About This Home
This home is located at 3513 W 400 N, Layton, UT 84041 and is currently estimated at $580,766, approximately $203 per square foot. 3513 W 400 N is a home located in Davis County with nearby schools including Sand Springs Elementary School, Legacy Junior High School, and Layton High School.
Ownership History
Date
Name
Owned For
Owner Type
Purchase Details
Closed on
Jun 21, 2013
Sold by
Infante Joseph K and Infante Holly
Bought by
Infante Joseph K and Infante Holly A
Current Estimated Value
Home Financials for this Owner
Home Financials are based on the most recent Mortgage that was taken out on this home.
Original Mortgage
$234,434
Outstanding Balance
$166,688
Interest Rate
3.48%
Mortgage Type
VA
Estimated Equity
$414,078
Purchase Details
Closed on
May 23, 2013
Sold by
Infante Holly and Lamb Holly
Bought by
Infante Joseph K and Infante Holly
Home Financials for this Owner
Home Financials are based on the most recent Mortgage that was taken out on this home.
Original Mortgage
$234,434
Outstanding Balance
$166,688
Interest Rate
3.48%
Mortgage Type
VA
Estimated Equity
$414,078
Purchase Details
Closed on
May 14, 2013
Sold by
Lamb Brandon
Bought by
Infante Holly
Home Financials for this Owner
Home Financials are based on the most recent Mortgage that was taken out on this home.
Original Mortgage
$234,434
Outstanding Balance
$166,688
Interest Rate
3.48%
Mortgage Type
VA
Estimated Equity
$414,078
Purchase Details
Closed on
Feb 25, 2010
Sold by
Lamb Holly and Lamb Brandon
Bought by
Lamb Brandon and Lamb Holly
Home Financials for this Owner
Home Financials are based on the most recent Mortgage that was taken out on this home.
Original Mortgage
$236,239
Interest Rate
5.03%
Mortgage Type
New Conventional
Purchase Details
Closed on
Dec 8, 2009
Sold by
Benchmark Real Estate Company
Bought by
Lamb Holly and Lamb Brandon
Home Financials for this Owner
Home Financials are based on the most recent Mortgage that was taken out on this home.
Original Mortgage
$65,000
Interest Rate
5.01%
Mortgage Type
Unknown
Purchase Details
Closed on
Jul 5, 2006
Sold by
U S Development Inc
Bought by
Benchmark Real Estate Co
Home Financials for this Owner
Home Financials are based on the most recent Mortgage that was taken out on this home.
Original Mortgage
$97,500
Interest Rate
6.63%
Mortgage Type
Purchase Money Mortgage
Purchase Details
Closed on
May 22, 2006
Sold by
Mountain Green Development Llc
Bought by
Us Development Inc
Home Financials for this Owner
Home Financials are based on the most recent Mortgage that was taken out on this home.
Original Mortgage
$97,500
Interest Rate
6.63%
Mortgage Type
Purchase Money Mortgage
Create a Home Valuation Report for This Property
The Home Valuation Report is an in-depth analysis detailing your home's value as well as a comparison with similar homes in the area
Home Values in the Area
Average Home Value in this Area
Purchase History
| Date | Buyer | Sale Price | Title Company |
|---|---|---|---|
| Infante Joseph K | -- | Metro National Title | |
| Infante Joseph K | -- | None Available | |
| Infante Holly | -- | None Available | |
| Lamb Brandon | -- | Founders Title Co Layt | |
| Lamb Holly | -- | Founders Title Co Layto | |
| Benchmark Real Estate Co | -- | Bonneville Superior Title Co | |
| Us Development Inc | -- | Bonneville Title Company |
Source: Public Records
Mortgage History
| Date | Status | Borrower | Loan Amount |
|---|---|---|---|
| Open | Infante Joseph K | $234,434 | |
| Previous Owner | Lamb Brandon | $236,239 | |
| Previous Owner | Lamb Holly | $65,000 | |
| Previous Owner | Lamb Holly | $216,000 | |
| Previous Owner | Benchmark Real Estate Co | $97,500 |
Source: Public Records
Tax History Compared to Growth
Tax History
| Year | Tax Paid | Tax Assessment Tax Assessment Total Assessment is a certain percentage of the fair market value that is determined by local assessors to be the total taxable value of land and additions on the property. | Land | Improvement |
|---|---|---|---|---|
| 2025 | $2,819 | $295,900 | $119,150 | $176,750 |
| 2024 | $2,715 | $287,100 | $130,041 | $157,059 |
| 2023 | $2,715 | $506,000 | $132,225 | $373,775 |
| 2022 | $2,923 | $295,900 | $80,300 | $215,600 |
| 2021 | $2,623 | $396,000 | $120,458 | $275,542 |
| 2020 | $2,362 | $342,000 | $101,969 | $240,031 |
| 2019 | $2,418 | $343,000 | $103,173 | $239,827 |
| 2018 | $2,226 | $317,000 | $90,651 | $226,349 |
| 2016 | $2,024 | $148,665 | $36,354 | $112,311 |
| 2015 | $1,872 | $130,515 | $36,354 | $94,161 |
| 2014 | $1,689 | $120,405 | $36,354 | $84,051 |
| 2013 | -- | $133,033 | $38,823 | $94,210 |
Source: Public Records
Map
Nearby Homes