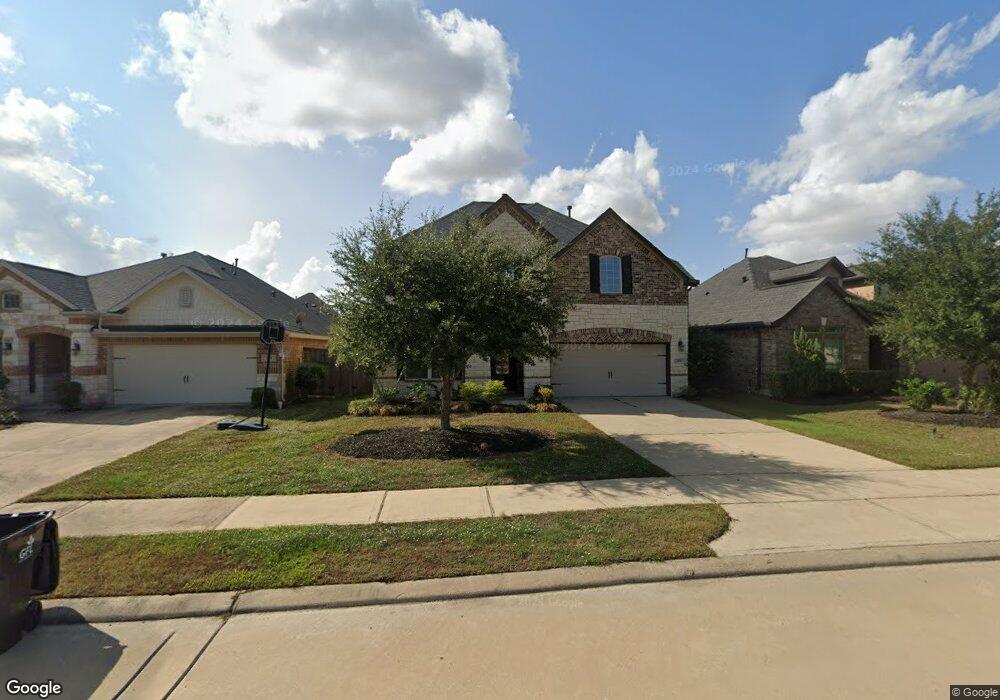
3514 Chestnut Grove Fulshear, TX 77441
Cross Creek Ranch NeighborhoodEstimated Value: $512,000 - $553,000
4
Beds
4
Baths
2,988
Sq Ft
$180/Sq Ft
Est. Value
About This Home
This home is located at 3514 Chestnut Grove, Fulshear, TX 77441 and is currently estimated at $538,253, approximately $180 per square foot. 3514 Chestnut Grove is a home located in Fort Bend County with nearby schools including Campbell Elementary School, Joe M. Adams Junior High, and Sugar Creek Montessori - Fulshear/West Katy.
Ownership History
Date
Name
Owned For
Owner Type
Purchase Details
Closed on
Sep 2, 2020
Sold by
Dinwiddie Properties Llc
Bought by
Potiny Suresh
Current Estimated Value
Home Financials for this Owner
Home Financials are based on the most recent Mortgage that was taken out on this home.
Original Mortgage
$260,625
Outstanding Balance
$231,712
Interest Rate
3%
Mortgage Type
New Conventional
Estimated Equity
$306,541
Purchase Details
Closed on
Feb 23, 2018
Sold by
Dinwindle Spencer
Bought by
Dinwidle Properties Llc
Purchase Details
Closed on
Apr 7, 2016
Sold by
Lennar Homes Of Texas Sales And Marketi
Bought by
Dinwidciie Spencer
Home Financials for this Owner
Home Financials are based on the most recent Mortgage that was taken out on this home.
Original Mortgage
$303,291
Interest Rate
3.25%
Mortgage Type
Adjustable Rate Mortgage/ARM
Purchase Details
Closed on
Sep 26, 2014
Sold by
Ccr Loan Subsidiary 1 Lp
Bought by
Dinwiddie Spencer
Create a Home Valuation Report for This Property
The Home Valuation Report is an in-depth analysis detailing your home's value as well as a comparison with similar homes in the area
Home Values in the Area
Average Home Value in this Area
Purchase History
| Date | Buyer | Sale Price | Title Company |
|---|---|---|---|
| Potiny Suresh | -- | None Available | |
| Dinwidle Properties Llc | -- | None Available | |
| Dinwidciie Spencer | -- | None Available | |
| Lennar Homes Of Texas Sales And Marketin | -- | None Available | |
| Dinwiddie Spencer | -- | -- | |
| Dinwiddie Spencer | -- | -- |
Source: Public Records
Mortgage History
| Date | Status | Borrower | Loan Amount |
|---|---|---|---|
| Open | Potiny Suresh | $260,625 | |
| Previous Owner | Dinwiddie Spencer | $303,291 |
Source: Public Records
Tax History Compared to Growth
Tax History
| Year | Tax Paid | Tax Assessment Tax Assessment Total Assessment is a certain percentage of the fair market value that is determined by local assessors to be the total taxable value of land and additions on the property. | Land | Improvement |
|---|---|---|---|---|
| 2025 | $14,604 | $504,181 | $68,900 | $435,281 |
| 2024 | $14,604 | $527,297 | $68,900 | $458,397 |
| 2023 | $13,886 | $490,198 | $53,000 | $437,198 |
| 2022 | $13,887 | $438,970 | $53,000 | $385,970 |
| 2021 | $11,415 | $341,520 | $53,000 | $288,520 |
| 2020 | $11,076 | $323,960 | $50,000 | $273,960 |
| 2019 | $10,896 | $304,220 | $50,000 | $254,220 |
| 2018 | $11,073 | $308,750 | $50,000 | $258,750 |
| 2017 | $11,287 | $314,270 | $50,000 | $264,270 |
| 2016 | $8,054 | $224,240 | $50,000 | $174,240 |
| 2015 | $906 | $40,000 | $40,000 | $0 |
Source: Public Records
Map
Nearby Homes
- 3422 Walker Falls Ln
- 28131 Twin Knolls Ln
- 3438 Cartwright Cliff Ln
- 27830 Hunters Rock Ln
- 27834 Hunters Rock Ln
- 3710 Meadowmist Ct
- 3314 Flint Valley Ln
- 27603 Huggins Crest Ct
- 27719 Merchant Hills Ln
- 3523 Shearwater St
- 27514 Wilson Run Ln
- 3527 Shearwater St
- 3843 Desert Springs Ln
- 3535 Blue Mockingbird St
- 3422 Auburn Creek Cir
- 27423 Sunrise Ranch Ln
- 27419 Canyon Reach Dr
- 3547 Shearwater St
- CACTUS Plan at Tamarron - Villarosa
- KLINE Plan at Tamarron - Villarosa
- 3506 Chestnut Grove Ln
- 3510 Chestnut Grove Ln
- 3502 Chestnut Grove Ln
- 3507 Chestnut Grove Ln
- 3507 Chestnut Grove Ln
- 3514 Chestnut Grove Ln
- 3503 Chestnut Grove
- 3518 Chestnut Grove Ln
- 3511 Chestnut Grove Ln
- 3511 Chestnut Grove Ln
- 3515 Chestnut Grove Ln
- 3515 Chestnut Grove Ln
- 3435 Satton Ranch Ln
- 3522 Chestnut Grove Ln
- 3503 Big Hickory Ct
- 3426 Satton Ranch Ln
- 3519 Chestnut Grove Ln
- 3523 Chestnut Grove Ln
- 3414 Satton Ranch Ln
- 3430 Satton Ranch Ln