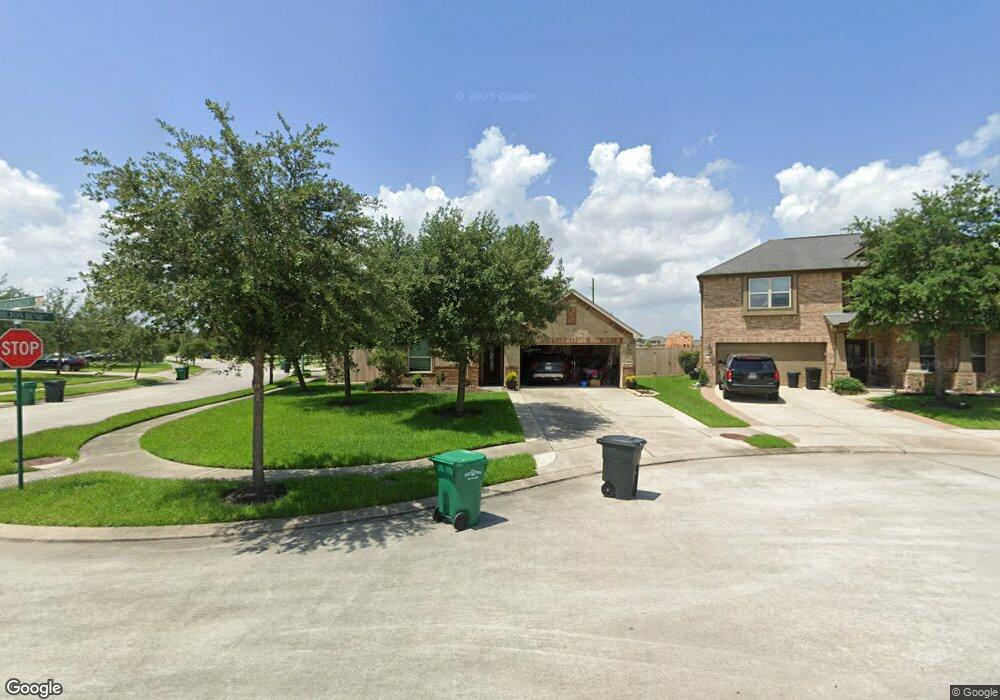
3514 Culico Falls Ct Spring, TX 77386
Imperial Oaks NeighborhoodEstimated Value: $344,177 - $379,000
--
Bed
2
Baths
2,136
Sq Ft
$170/Sq Ft
Est. Value
About This Home
This home is located at 3514 Culico Falls Ct, Spring, TX 77386 and is currently estimated at $363,544, approximately $170 per square foot. 3514 Culico Falls Ct is a home located in Montgomery County with nearby schools including Birnham Woods Elementary School, York J High School, and Grand Oaks High School.
Ownership History
Date
Name
Owned For
Owner Type
Purchase Details
Closed on
Nov 21, 2014
Sold by
Schabot Melvin Douglas and Schabot Gaylene
Bought by
Schneider Erich Boyd and Schneider Holli Jayne
Current Estimated Value
Home Financials for this Owner
Home Financials are based on the most recent Mortgage that was taken out on this home.
Original Mortgage
$208,525
Outstanding Balance
$160,100
Interest Rate
4.14%
Mortgage Type
New Conventional
Estimated Equity
$203,444
Purchase Details
Closed on
Jul 30, 2012
Sold by
Lennar Homes Of Texas Sales & Marketing
Bought by
Schabot Melvin Douglas and Schabot Gaylene
Home Financials for this Owner
Home Financials are based on the most recent Mortgage that was taken out on this home.
Original Mortgage
$188,835
Interest Rate
3.68%
Mortgage Type
New Conventional
Create a Home Valuation Report for This Property
The Home Valuation Report is an in-depth analysis detailing your home's value as well as a comparison with similar homes in the area
Home Values in the Area
Average Home Value in this Area
Purchase History
| Date | Buyer | Sale Price | Title Company |
|---|---|---|---|
| Schneider Erich Boyd | -- | Chicago Title | |
| Schabot Melvin Douglas | -- | Nat | |
| Lennar Homes Of Texas Sales & Marketing | -- | Nat |
Source: Public Records
Mortgage History
| Date | Status | Borrower | Loan Amount |
|---|---|---|---|
| Open | Schneider Erich Boyd | $208,525 | |
| Previous Owner | Schabot Melvin Douglas | $188,835 |
Source: Public Records
Tax History Compared to Growth
Tax History
| Year | Tax Paid | Tax Assessment Tax Assessment Total Assessment is a certain percentage of the fair market value that is determined by local assessors to be the total taxable value of land and additions on the property. | Land | Improvement |
|---|---|---|---|---|
| 2025 | $6,515 | $342,733 | -- | -- |
| 2024 | $5,990 | $311,575 | -- | -- |
| 2023 | $5,990 | $283,250 | $58,000 | $282,000 |
| 2022 | $7,275 | $257,500 | $28,260 | $286,200 |
| 2021 | $7,184 | $234,090 | $28,260 | $205,830 |
| 2020 | $7,794 | $240,250 | $28,260 | $211,990 |
| 2019 | $7,769 | $233,000 | $28,260 | $204,740 |
| 2018 | $6,739 | $219,440 | $28,260 | $191,180 |
| 2017 | $7,377 | $219,440 | $28,260 | $191,180 |
| 2016 | $7,302 | $217,210 | $28,260 | $188,950 |
| 2015 | $5,768 | $217,210 | $28,260 | $188,950 |
| 2014 | $5,768 | $194,950 | $28,260 | $173,590 |
Source: Public Records
Map
Nearby Homes
- 31964 Retama Ranch Ln
- 31988 Retama Ranch Ln
- 31976 Retama Ranch Ln
- 31985 Retama Ranch Ln
- 31989 Retama Ranch Ln
- 31984 Retama Ranch Ln
- 31981 Retama Ranch Ln
- 3252 Bright Maple Dr
- 3248 Bright Maple Dr
- 31996 Retama Ranch Ln
- 3236 Bright Maple Dr
- 32027 Retama Ranch Ln
- 31992 Retama Ranch Ln
- 3280 Bright Maple Dr
- 31993 Retama Ranch Ln
- 32015 Retama Ranch Ln
- 31972 Retama Ranch Ln
- 3240 Bright Maple Dr
- 3272 Bright Maple Dr
- 31739 Dover Oaks Ln
- 3510 Culico Falls Ct
- 31755 Summit Springs Ln
- 3506 Culico Falls Ct
- 31751 Summit Springs Ln
- 3506 Hamilton Bend Ln
- 31754 Summit Springs Ln
- 3510 Hamilton Bend Ln
- 31746 Summit Springs Ln
- 31747 Summit Springs Ln
- 3515 Culico Falls Ct
- 3511 Culico Falls Ct
- 3502 Culico Falls Ct
- 3507 Culico Falls Ct
- 31742 Summit Springs Ln
- 31743 Summit Springs Ln
- 3514 Hamilton Bend Ln
- 31723 Ravens Bluff Ln
- 31738 Summit Springs Ln
- 3515 Hamilton Bend Ln
- 31727 Ravens Bluff Ln