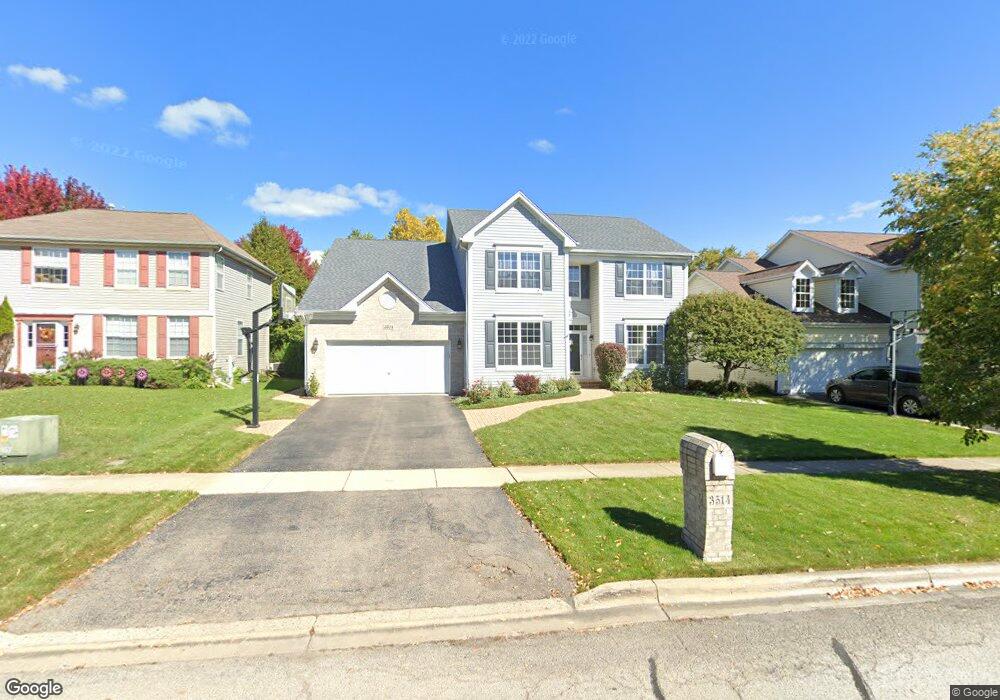
3514 Voltaire Ln Unit 3 Saint Charles, IL 60175
Rainbow Hills NeighborhoodEstimated Value: $574,000 - $586,000
5
Beds
5
Baths
3,400
Sq Ft
$171/Sq Ft
Est. Value
About This Home
This home is located at 3514 Voltaire Ln Unit 3, Saint Charles, IL 60175 and is currently estimated at $580,999, approximately $170 per square foot. 3514 Voltaire Ln Unit 3 is a home located in Kane County with nearby schools including Ferson Creek Elementary School, Thompson Middle School, and St Charles East High School.
Ownership History
Date
Name
Owned For
Owner Type
Purchase Details
Closed on
May 26, 2017
Sold by
Cane Joseph G and Cane Debra S
Bought by
Taylor Russell S and Lukaszczyk Elizabeth
Current Estimated Value
Home Financials for this Owner
Home Financials are based on the most recent Mortgage that was taken out on this home.
Original Mortgage
$280,000
Outstanding Balance
$229,509
Interest Rate
3.5%
Mortgage Type
Adjustable Rate Mortgage/ARM
Estimated Equity
$351,490
Purchase Details
Closed on
Aug 15, 2001
Sold by
Wiseman Hughes Enterprises Inc
Bought by
Cane Joseph G and Cane Debra S
Home Financials for this Owner
Home Financials are based on the most recent Mortgage that was taken out on this home.
Original Mortgage
$247,900
Interest Rate
7.28%
Create a Home Valuation Report for This Property
The Home Valuation Report is an in-depth analysis detailing your home's value as well as a comparison with similar homes in the area
Home Values in the Area
Average Home Value in this Area
Purchase History
| Date | Buyer | Sale Price | Title Company |
|---|---|---|---|
| Taylor Russell S | $350,000 | Fidelity National Title | |
| Cane Joseph G | $310,000 | Chicago Title Insurance Co |
Source: Public Records
Mortgage History
| Date | Status | Borrower | Loan Amount |
|---|---|---|---|
| Open | Taylor Russell S | $280,000 | |
| Previous Owner | Cane Joseph G | $247,900 |
Source: Public Records
Tax History Compared to Growth
Tax History
| Year | Tax Paid | Tax Assessment Tax Assessment Total Assessment is a certain percentage of the fair market value that is determined by local assessors to be the total taxable value of land and additions on the property. | Land | Improvement |
|---|---|---|---|---|
| 2024 | $11,109 | $157,648 | $32,770 | $124,878 |
| 2023 | $10,652 | $141,098 | $29,330 | $111,768 |
| 2022 | $10,310 | $133,693 | $31,815 | $101,878 |
| 2021 | $9,904 | $127,436 | $30,326 | $97,110 |
| 2020 | $9,799 | $125,060 | $29,761 | $95,299 |
| 2019 | $9,622 | $122,584 | $29,172 | $93,412 |
| 2018 | $9,521 | $120,785 | $28,635 | $92,150 |
| 2017 | $10,083 | $120,335 | $27,656 | $92,679 |
| 2016 | $10,607 | $116,109 | $26,685 | $89,424 |
| 2015 | -- | $110,137 | $26,397 | $83,740 |
| 2014 | -- | $108,442 | $26,397 | $82,045 |
| 2013 | -- | $112,417 | $26,661 | $85,756 |
Source: Public Records
Map
Nearby Homes
- 3534 Matisse Dr
- 242 Remington Dr
- 3122 W Main St
- 38W691 W Mary Ln
- 3042 Saint Michel Ln
- 243 Valley View Dr Unit 2
- 264 Valley View Dr Unit 2
- 306 Fairmont Ct
- 39W278 Baert Ln
- 423 Horizon Dr W
- 535 Red Sky Dr
- 810 Thornwood Dr
- 39W709 Walt Whitman Rd
- 3006 Langston Cir
- 39W599 Walt Whitman Rd Unit 13
- 4N494 Hidden Oaks Rd
- 39W663 Henry David Thoreau Place
- 4N427 Robert Penn Warren Cove
- 5N113 Burr Rd
- 5N107 Burr Rd
- 3510 Voltaire Ln Unit 3
- 3518 Voltaire Ln
- 3509 Antoine Place Unit 3
- 3522 Voltaire Ln
- 3506 Voltaire Ln
- 3505 Antoine Place
- 3515 Antoine Place Unit 3
- 3517 Antoine Place
- 3501 Antoine Place
- 3515 Voltaire Ln
- 3526 Voltaire Ln
- 3502 Voltaire Ln Unit 3
- 3511 Voltaire Ln
- 3519 Voltaire Ln
- 3507 Voltaire Ln
- 3521 Antoine Place Unit 3
- 3443 Antoine Place
- 3523 Voltaire Ln
- 3444 Voltaire Ln Unit 3
- 3530 Voltaire Ln