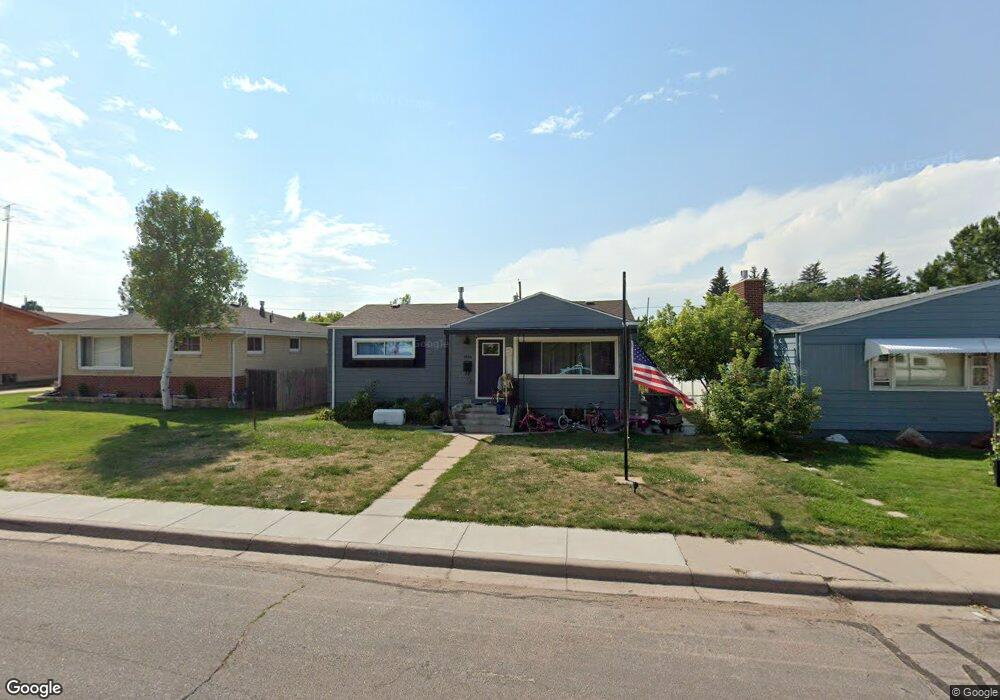
3516 Amherst Rd Cheyenne, WY 82001
Estimated Value: $316,000 - $360,000
4
Beds
2
Baths
856
Sq Ft
$403/Sq Ft
Est. Value
About This Home
This home is located at 3516 Amherst Rd, Cheyenne, WY 82001 and is currently estimated at $344,988, approximately $403 per square foot. 3516 Amherst Rd is a home located in Laramie County with nearby schools including Henderson Elementary School, Carey Junior High School, and East High School.
Ownership History
Date
Name
Owned For
Owner Type
Purchase Details
Closed on
Apr 30, 2020
Sold by
House Buyers Llc
Bought by
Jordan Jenae
Current Estimated Value
Home Financials for this Owner
Home Financials are based on the most recent Mortgage that was taken out on this home.
Original Mortgage
$250,381
Outstanding Balance
$221,114
Interest Rate
3.12%
Mortgage Type
FHA
Estimated Equity
$123,874
Purchase Details
Closed on
Dec 9, 2019
Sold by
Mitchell James S
Bought by
House Buyers Llc
Home Financials for this Owner
Home Financials are based on the most recent Mortgage that was taken out on this home.
Original Mortgage
$161,000
Interest Rate
3.75%
Mortgage Type
Unknown
Purchase Details
Closed on
Aug 20, 2019
Sold by
Palhuck Melanie K
Bought by
Mitchell James S
Purchase Details
Closed on
Sep 14, 2000
Sold by
Oguin Melanie K and Palluck Melanie K
Bought by
Palluck Melanie K
Home Financials for this Owner
Home Financials are based on the most recent Mortgage that was taken out on this home.
Original Mortgage
$64,400
Interest Rate
8.01%
Create a Home Valuation Report for This Property
The Home Valuation Report is an in-depth analysis detailing your home's value as well as a comparison with similar homes in the area
Home Values in the Area
Average Home Value in this Area
Purchase History
| Date | Buyer | Sale Price | Title Company |
|---|---|---|---|
| Jordan Jenae | -- | None Available | |
| House Buyers Llc | -- | None Available | |
| Mitchell James S | -- | None Available | |
| Palluck Melanie K | -- | -- |
Source: Public Records
Mortgage History
| Date | Status | Borrower | Loan Amount |
|---|---|---|---|
| Open | Jordan Jenae | $250,381 | |
| Previous Owner | House Buyers Llc | $161,000 | |
| Previous Owner | Palluck Melanie K | $64,400 |
Source: Public Records
Tax History Compared to Growth
Tax History
| Year | Tax Paid | Tax Assessment Tax Assessment Total Assessment is a certain percentage of the fair market value that is determined by local assessors to be the total taxable value of land and additions on the property. | Land | Improvement |
|---|---|---|---|---|
| 2025 | $1,706 | $18,822 | $2,910 | $15,912 |
| 2024 | $1,706 | $24,129 | $3,880 | $20,249 |
| 2023 | $1,736 | $24,544 | $3,880 | $20,664 |
| 2022 | $1,488 | $20,611 | $3,880 | $16,731 |
| 2021 | $1,410 | $19,498 | $3,880 | $15,618 |
| 2020 | $1,163 | $16,125 | $3,880 | $12,245 |
| 2019 | $1,127 | $15,604 | $3,880 | $11,724 |
| 2018 | $1,013 | $14,166 | $3,587 | $10,579 |
| 2017 | $1,012 | $14,024 | $3,587 | $10,437 |
| 2016 | $947 | $13,121 | $3,419 | $9,702 |
| 2015 | $881 | $12,201 | $3,419 | $8,782 |
| 2014 | $970 | $13,339 | $3,419 | $9,920 |
Source: Public Records
Map
Nearby Homes
- 3628 Amherst Rd
- 3561 Boston Rd
- 3529 Concord Rd
- 1702 Newton Dr
- 3333 Duff Ave
- 1813 Newton Dr
- 1408 E 22nd St
- 1731 E Pershing Blvd
- 1813 Andover Dr
- 1801 Milton Dr
- 1751 E Pershing Blvd
- 1610 E 20th St
- 1808 E 21st St
- 3700 Essex Rd
- 1958 Newton Dr
- 2122 Morrie Ave
- 1209 E 20th St
- 1323 E 19th St Unit 1-4
- 1118 E 19th St
- 3444 Dover Rd
- 3512 Amherst Rd
- 3522 Amherst Rd
- 3508 Amherst Rd
- 3526 Amherst Rd
- 3521 Dunn Ave
- 3515 Dunn Ave
- 3525 Dunn Ave
- 3511 Dunn Ave
- 3501 Amherst Rd
- 3530 Amherst Rd
- 3500 Amherst Rd
- 3529 Dunn Ave
- 3507 Dunn Ave
- 3515 Amherst Rd
- 1508 Oxford Dr
- 3533 Dunn Ave
- 3523 Amherst Rd
- 3501 Dunn Ave
- 3529 Amherst Rd
- 1512 Oxford Dr