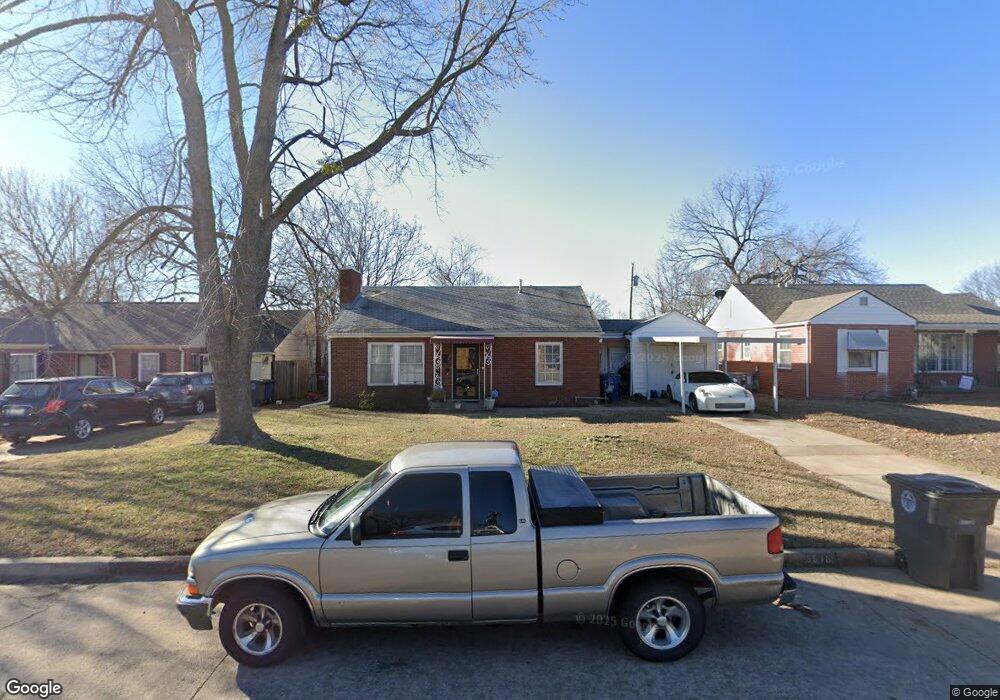
3516 E Haskell Place Tulsa, OK 74115
Sequoyah NeighborhoodEstimated Value: $99,000 - $170,000
2
Beds
1
Bath
1,011
Sq Ft
$132/Sq Ft
Est. Value
About This Home
This home is located at 3516 E Haskell Place, Tulsa, OK 74115 and is currently estimated at $133,891, approximately $132 per square foot. 3516 E Haskell Place is a home located in Tulsa County with nearby schools including Sequoyah Elementary School, Monroe Demonstration Academy, and McLain High School of Science and Technology.
Ownership History
Date
Name
Owned For
Owner Type
Purchase Details
Closed on
Mar 2, 2009
Sold by
Taylor Cathy Jeanne and Norton Betty Jeanne
Bought by
Norton Betty Jeanne
Current Estimated Value
Home Financials for this Owner
Home Financials are based on the most recent Mortgage that was taken out on this home.
Original Mortgage
$97,500
Interest Rate
3.09%
Mortgage Type
Reverse Mortgage Home Equity Conversion Mortgage
Purchase Details
Closed on
Jun 29, 2006
Sold by
Hunt John W and Hunt Robyn
Bought by
Patterson Michael
Purchase Details
Closed on
Jul 16, 2004
Sold by
Va
Bought by
Hunt John W and Hunt Robyn
Purchase Details
Closed on
Oct 15, 2003
Sold by
Walker John D and Walker Teresa C
Bought by
Va
Create a Home Valuation Report for This Property
The Home Valuation Report is an in-depth analysis detailing your home's value as well as a comparison with similar homes in the area
Home Values in the Area
Average Home Value in this Area
Purchase History
| Date | Buyer | Sale Price | Title Company |
|---|---|---|---|
| Norton Betty Jeanne | -- | First American Title & Abstr | |
| Patterson Michael | $50,000 | None Available | |
| Hunt John W | -- | First American Title & Abstr | |
| Va | -- | -- |
Source: Public Records
Mortgage History
| Date | Status | Borrower | Loan Amount |
|---|---|---|---|
| Previous Owner | Norton Betty Jeanne | $97,500 |
Source: Public Records
Tax History
| Year | Tax Paid | Tax Assessment Tax Assessment Total Assessment is a certain percentage of the fair market value that is determined by local assessors to be the total taxable value of land and additions on the property. | Land | Improvement |
|---|---|---|---|---|
| 2025 | $1,024 | $7,641 | $1,013 | $6,628 |
| 2024 | $879 | $7,277 | $1,157 | $6,120 |
| 2023 | $879 | $6,930 | $1,212 | $5,718 |
| 2022 | $880 | $6,600 | $1,385 | $5,215 |
| 2021 | $872 | $6,600 | $1,385 | $5,215 |
| 2020 | $860 | $6,600 | $1,385 | $5,215 |
| 2019 | $975 | $7,113 | $1,385 | $5,728 |
| 2018 | $977 | $7,113 | $1,385 | $5,728 |
| 2017 | $959 | $6,999 | $1,363 | $5,636 |
| 2016 | $895 | $6,666 | $1,298 | $5,368 |
| 2015 | $897 | $6,666 | $1,298 | $5,368 |
| 2014 | $888 | $6,666 | $1,298 | $5,368 |
Source: Public Records
Map
Nearby Homes
- 3536 E Haskell St
- 3346 E Jasper St
- 3310 E Admiral Ct
- 3212 E Haskell St
- 815 N Oswego Ave
- 504 N Florence Place
- 3932 E Admiral Ct
- 3118 E Archer St
- 103 S Knoxville Ave
- 111 N Quebec Ave
- 3015 E Archer St
- 141 N College Ave
- 1055 N New Haven Ave
- 204 S Jamestown Ave
- 3741 E 2nd St
- 1049 N Oswego Ave
- 3714 E 2nd Place
- 818 N Toledo Ave
- 1043 N College Ave
- 812 N Delaware Place
- 3520 E Haskell Place
- 3512 E Haskell Place
- 3528 E Haskell Place
- 3504 E Haskell Place
- 3515 E Haskell St
- 3523 E Haskell St
- 3505 E Haskell St
- 3532 E Haskell Place
- 3515 E Haskell Place
- 3511 E Haskell Place
- 3519 E Haskell Place
- 3503 E Haskell St
- 3525 E Haskell Place
- 3531 E Haskell St
- 3536 E Haskell Place
- 3503 E Haskell Place
- 3529 E Haskell Place
- 3346 E Haskell Place
- 704 N Knoxville Ave
- 3423 E Haskell St
Your Personal Tour Guide
Ask me questions while you tour the home.