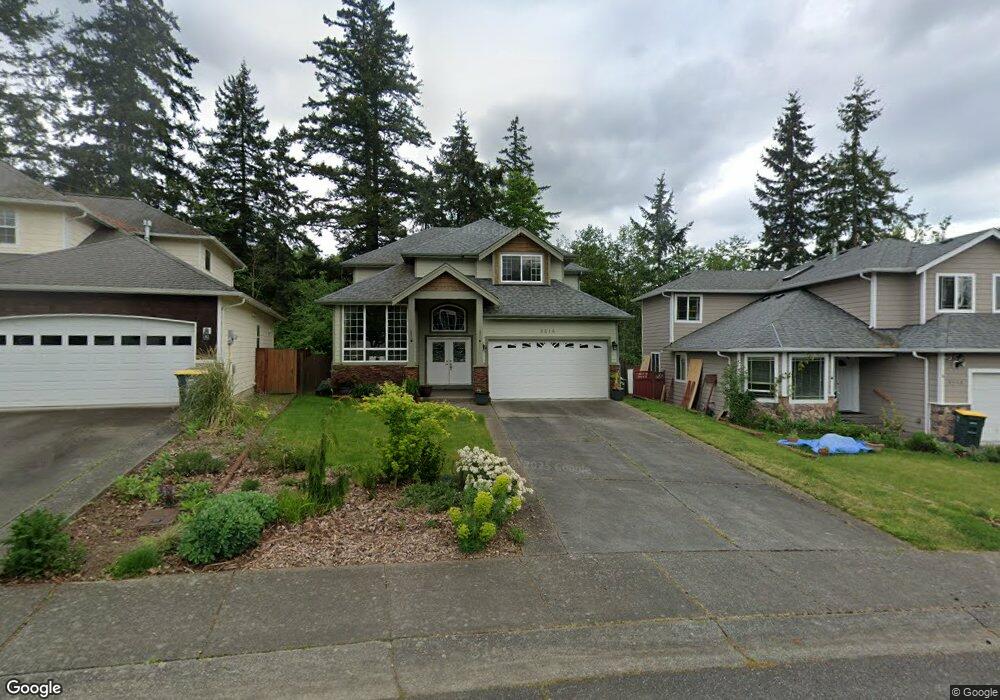
3516 Skylark Loop Bellingham, WA 98226
Barkley NeighborhoodEstimated Value: $571,000 - $718,000
3
Beds
3
Baths
2,140
Sq Ft
$314/Sq Ft
Est. Value
About This Home
This home is located at 3516 Skylark Loop, Bellingham, WA 98226 and is currently estimated at $671,333, approximately $313 per square foot. 3516 Skylark Loop is a home located in Whatcom County with nearby schools including Northern Heights Elementary School, Shuksan Middle School, and Squalicum High School.
Ownership History
Date
Name
Owned For
Owner Type
Purchase Details
Closed on
Jul 27, 2021
Sold by
Malan Jean F and Malan Andrea M
Bought by
Vitt Michael
Current Estimated Value
Home Financials for this Owner
Home Financials are based on the most recent Mortgage that was taken out on this home.
Original Mortgage
$320,000
Outstanding Balance
$291,110
Interest Rate
2.93%
Mortgage Type
New Conventional
Estimated Equity
$380,223
Purchase Details
Closed on
Feb 7, 2006
Sold by
Umbrella Homes Inc
Bought by
Malan Jean F and Malan Andrea M
Home Financials for this Owner
Home Financials are based on the most recent Mortgage that was taken out on this home.
Original Mortgage
$358,102
Interest Rate
6.16%
Mortgage Type
Fannie Mae Freddie Mac
Purchase Details
Closed on
Dec 28, 2004
Sold by
Dietrich Construction Llc
Bought by
Umbrella Homes Inc
Home Financials for this Owner
Home Financials are based on the most recent Mortgage that was taken out on this home.
Original Mortgage
$880,000
Interest Rate
5.74%
Mortgage Type
Purchase Money Mortgage
Create a Home Valuation Report for This Property
The Home Valuation Report is an in-depth analysis detailing your home's value as well as a comparison with similar homes in the area
Home Values in the Area
Average Home Value in this Area
Purchase History
| Date | Buyer | Sale Price | Title Company |
|---|---|---|---|
| Vitt Michael | $570,000 | Chicago Title | |
| Malan Jean F | $377,230 | Chicago Title Insurance | |
| Umbrella Homes Inc | $315,996 | Chicago Title Insurance |
Source: Public Records
Mortgage History
| Date | Status | Borrower | Loan Amount |
|---|---|---|---|
| Open | Vitt Michael | $320,000 | |
| Previous Owner | Malan Jean F | $358,102 | |
| Previous Owner | Umbrella Homes Inc | $880,000 |
Source: Public Records
Tax History Compared to Growth
Tax History
| Year | Tax Paid | Tax Assessment Tax Assessment Total Assessment is a certain percentage of the fair market value that is determined by local assessors to be the total taxable value of land and additions on the property. | Land | Improvement |
|---|---|---|---|---|
| 2024 | $5,018 | $617,558 | $211,408 | $406,150 |
| 2023 | $5,018 | $644,714 | $220,704 | $424,010 |
| 2022 | $4,365 | $565,538 | $193,600 | $371,938 |
| 2021 | $4,278 | $467,387 | $160,000 | $307,387 |
| 2020 | $4,177 | $432,844 | $109,039 | $323,805 |
| 2019 | $3,749 | $404,370 | $101,955 | $302,415 |
| 2018 | $3,877 | $362,689 | $91,455 | $271,234 |
| 2017 | $3,380 | $320,911 | $80,920 | $239,991 |
| 2016 | $3,330 | $291,596 | $73,640 | $217,956 |
| 2015 | $3,286 | $277,874 | $70,000 | $207,874 |
| 2014 | -- | $266,661 | $72,240 | $194,421 |
| 2013 | -- | $255,119 | $70,000 | $185,119 |
Source: Public Records
Map
Nearby Homes
- 3001 E Sunset Dr
- 3010 E Sunset Dr
- 0 E Bakerview Rd Unit NWM2398341
- 3606 Tree Farm Ct
- 3713 Bristol St
- 3709 Bristol St
- 3715 E Sunset Dr
- 3817 E Sunset Dr
- 2870 E Bakerview Rd
- 2809 E Sunset Dr
- 3527 Sussex Dr
- 1314 Welling Rd
- 4160 Hannegan Rd
- 1368 Roma Rd
- 3827 Keystone Way
- 1379 Northwood Ct
- 3159 Chandler Pkwy
- 2413 E Sunset Dr
- 3155 Chandler Pkwy
- 3153 Chandler Pkwy
- 3512 Skylark Loop
- 3520 Skylark Loop
- 3508 Skylark Loop
- 3524 Skylark Loop
- 3519 Skylark Loop
- 3528 Skylark Loop
- 3504 Skylark Loop
- 3513 Skylark Loop
- 3509 Skylark Loop
- 3532 Skylark Loop
- 3533 Skylark Loop
- 3500 Skylark Loop
- 3505 Skylark Loop
- 3964 Trickle Creek Blvd
- 3537 Skylark Loop
- 3501 Skylark Loop
- 3518 Redondo Way
- 3536 Skylark Loop
- 3514 Redondo Way
- 3526 Redondo Way