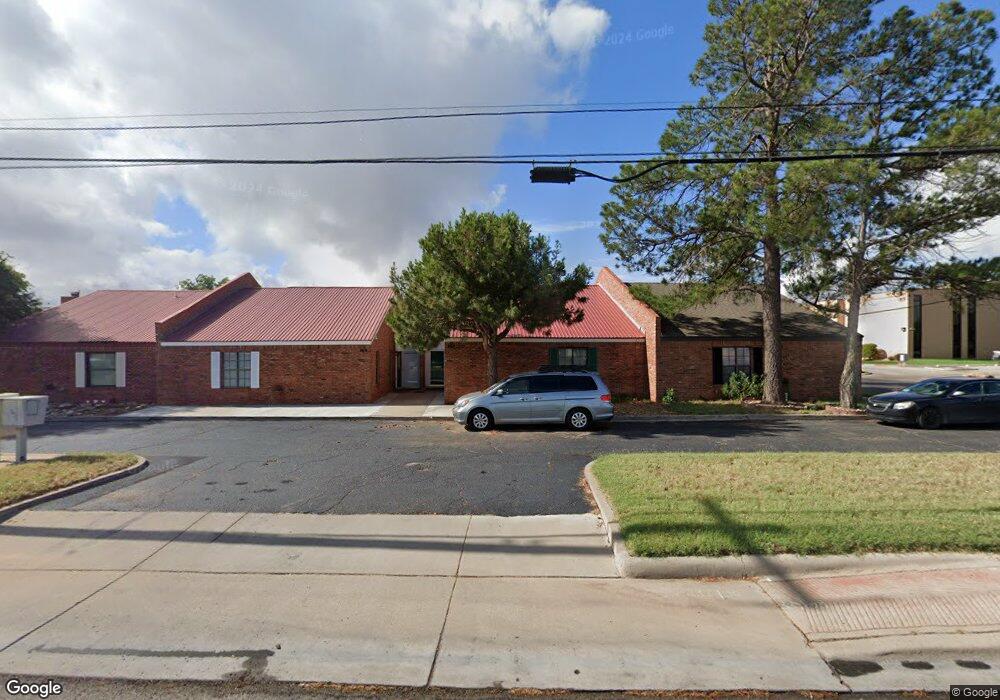
3517 Andrews Hwy Midland, TX 79703
Estimated Value: $157,941 - $241,000
3
Beds
2
Baths
1,228
Sq Ft
$172/Sq Ft
Est. Value
About This Home
This home is located at 3517 Andrews Hwy, Midland, TX 79703 and is currently estimated at $210,985, approximately $171 per square foot. 3517 Andrews Hwy is a home located in Midland County with nearby schools including Alamo Junior High School, Midland Montessori School, and Grace Lutheran Early Child Program.
Ownership History
Date
Name
Owned For
Owner Type
Purchase Details
Closed on
Dec 4, 2024
Sold by
Equus Capital Inc
Bought by
Collins Capital Holdings Lp
Current Estimated Value
Purchase Details
Closed on
Jan 26, 2024
Sold by
Johannsen Stanley R and Johannsen Veretta A
Bought by
Equus Capital Inc
Purchase Details
Closed on
Sep 28, 2006
Sold by
Mckinney Sheila L Simpson and Mckinney Gary Dale
Bought by
Johannsen Stanley R and Johannsen Veretta A
Purchase Details
Closed on
Aug 1, 1996
Bought by
Johannsen Stanley R
Purchase Details
Closed on
Jan 13, 1989
Bought by
Johannsen Stanley R
Purchase Details
Closed on
Dec 28, 1988
Bought by
Johannsen Stanley R
Purchase Details
Closed on
Aug 3, 1983
Bought by
Johannsen Stanley R
Create a Home Valuation Report for This Property
The Home Valuation Report is an in-depth analysis detailing your home's value as well as a comparison with similar homes in the area
Home Values in the Area
Average Home Value in this Area
Purchase History
| Date | Buyer | Sale Price | Title Company |
|---|---|---|---|
| Collins Capital Holdings Lp | -- | None Listed On Document | |
| Collins Capital Holdings Lp | -- | None Listed On Document | |
| Equus Capital Inc | -- | West Texas Abstract & Title | |
| Johannsen Stanley R | -- | None Available | |
| Johannsen Stanley R | -- | -- | |
| Johannsen Stanley R | -- | -- | |
| Johannsen Stanley R | -- | -- | |
| Johannsen Stanley R | -- | -- |
Source: Public Records
Tax History Compared to Growth
Tax History
| Year | Tax Paid | Tax Assessment Tax Assessment Total Assessment is a certain percentage of the fair market value that is determined by local assessors to be the total taxable value of land and additions on the property. | Land | Improvement |
|---|---|---|---|---|
| 2025 | $629 | $125,430 | $7,330 | $118,100 |
| 2024 | $632 | $129,890 | $7,330 | $122,560 |
| 2023 | $621 | $129,890 | $7,330 | $122,560 |
| 2022 | $1,981 | $126,800 | $7,330 | $119,470 |
| 2021 | $2,177 | $124,940 | $7,330 | $117,610 |
| 2020 | $988 | $119,960 | $7,330 | $112,630 |
| 2019 | $2,271 | $119,960 | $7,330 | $112,630 |
| 2018 | $2,167 | $111,450 | $7,330 | $104,120 |
| 2017 | $2,196 | $112,930 | $7,330 | $105,600 |
| 2016 | $1,993 | $110,340 | $7,330 | $103,010 |
| 2015 | -- | $107,770 | $7,330 | $100,500 |
| 2014 | -- | $97,970 | $0 | $0 |
Source: Public Records
Map
Nearby Homes
- 3523 Lonoke Ave
- 1502 Alcove Ct
- 1103 Tarleton St
- 1509 Cascade Ct
- 3214 Lockheed Dr
- 3213 Sentinel Dr
- 3517 Seaboard Ave
- 3204 Shell Ave
- 3213 Shell Ave
- 2106 Rosita Dr
- 2000 Freeport Ln
- 3209 Sinclair Ave
- 3206 W Golf Course Rd
- 3204 W Golf Course Rd
- 3205 Boyd Ave
- 2607 Bedford Ave
- 1702 Cessna Dr
- 2121 Bonham St
- 5 Bristol Ct
- 3311 Terrace Ave
- 3515 Andrews Hwy
- 3519 Andrews Hwy
- 3513 Andrews Hwy
- 3511 Andrews Hwy
- 3504 Lockheed Ave
- 3509 Andrews Hwy
- 3507 Andrews Hwy
- 3502 Lockheed Ave
- 3505 Andrews Hwy
- 3503 Andrews Hwy
- 3500 Lockheed Ave
- 3501 Andrews Hwy
- 3600 Monclave Dr
- 3505 Lockheed Ave
- 3521 Lonoke Ave
- 3602 Monclave Dr
- 3503 Lockheed Ave
- 4816 Andrews Hwy
- 3604 Monclave Dr
- 3525 Lonoke Ave