NOT LISTED FOR SALE

Estimated Value: $435,000 - $483,000

3 Beds
2 Baths
1,797 Sq Ft
$253/Sq Ft Est. Value

Last Sold March 31, 2014

Last sale price $225,000 $125 Per Sq Ft

Est. 102% increase in value since last sale

Current estimated payment $2,642/month

About This Home

As of March 2014

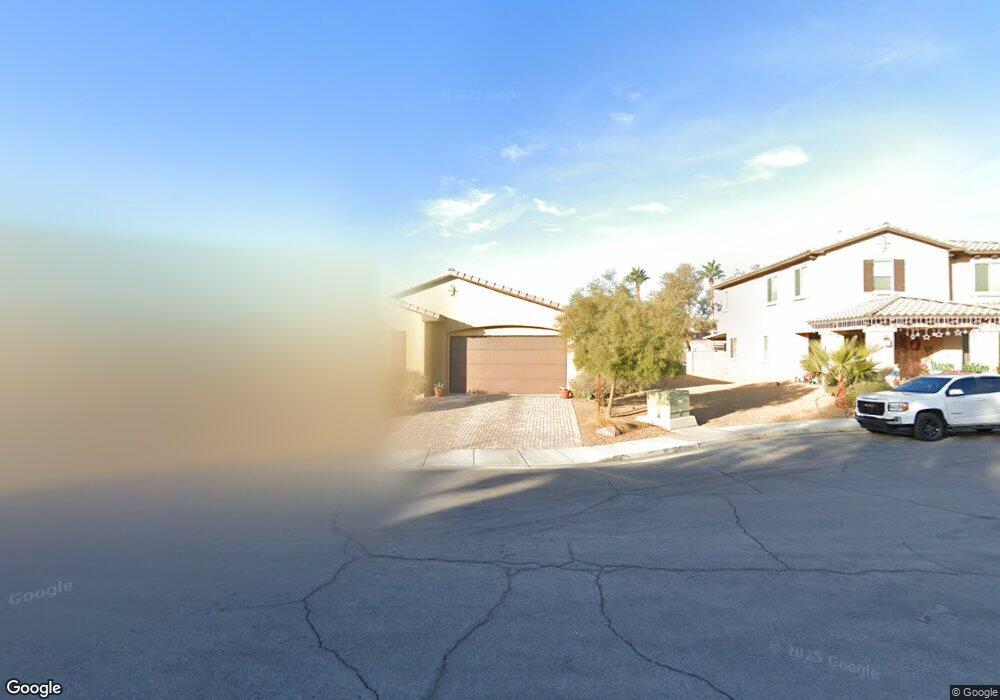
Delhi Estates is a cozy 14 lot community in the suburban northwest, this single story home is both stylish & functional on a large cul-de-sac lot. Open layout, 9' ceilings, amazing kitchen with huge island/breakfast bar, granite countertops, raised panel 42" cabinetry with 3" crown molding, walk-in pantry & GE kitchen appliances. 3 beds w/separate den. Paverstone driveway, patio, front yard desert landscaping and more!

Ownership History

Date Name Owned For Owner Type

Purchase Details

Closed on
Jan 24, 2014
Sold by
Harmony Delhi Estates Llc
Bought by
Prince Glenn David and Prince Rosemarie
Current Estimated Value
$454,136

Home Financials for this Owner

Home Financials are based on the most recent Mortgage that was taken out on this home.
Original Mortgage
$199,990
Outstanding Balance
$151,888
Interest Rate
4.47%
Mortgage Type
VA
Estimated Equity
$302,248

Purchase Details

Closed on
Dec 21, 2010
Sold by
Bebe 14 Llc
Bought by
Great Western Bank
Source: Public Records

Range of Values:

Collateral Analytics

Collateral Analytics Collateral Analytics AVMs (Automated Valuation Model) employ a number of statistical approaches combined with neighborhood-specific comparable selection guarantees the most up-to-date and precise valuations.

Not Available

Collateral Analytics does not have data for the current month. Please view the chart for historical values.

ICE

ICE Mortgage Technology ICE Mortgage Technology’s AVM (Automated Valuation Model) is a state-of-the-art online residential property valuation tool that provides a quick and accurate estimate of the value of almost any home in the U.S.

Not Available

ICE Mortgage Technology does not have data for the current month. Please view the chart for historical values.

First American

First American First American Data & Analytics’ next-generation AVM combines unrivaled data assets with a blended ensemble of valuation models to produce highly accurate, reliable valuations you can trust.

Not Available

First American does not have data for the current month. Please view the chart for historical values.

Quantarium

Quantarium Quantarium’s valuation service, repeatedly proven the industry’s most accurate and comprehensive, is supercharged with a self-learning and auto-tuning AI engine that continually becomes smarter and more accurate as it processes daily inputs from the industry’s leading RE data lake.

Not Available

Quantarium does not have data for the current month. Please view the chart for historical values.

Average Value
Not Available
List Price
Sold Price
Create a Home Valuation Report for This Property
The Home Valuation Report is an in-depth analysis detailing your home's value as well as a comparison with similar homes in the area

Home Values in the Area

Source: Public Records

Average Home Value in this Area


Source: Public Records

Purchase History

Date Buyer Sale Price Title Company
Prince Glenn David $199,990 Nevada Title Las Vegas
Great Western Bank $140,000 None Available
Source: Public Records

Mortgage History

Date Status Borrower Loan Amount
Open Prince Glenn David $199,990
Source: Public Records

Property History

Date Event Price List to Sale Price per Sq Ft Prior Sale
03/31/2014 03/31/14 Sold $225,000 +12.5% $125 / Sq Ft View Prior Sale
03/01/2014 03/01/14 Pending -- -- --
12/07/2013 12/07/13 For Sale $199,990 -- $111 / Sq Ft

Tax History Compared to Growth

Source: Public Records

Tax History

Year Tax Paid Tax Assessment Tax Assessment Total Assessment is a certain percentage of the fair market value that is determined by local assessors to be the total taxable value of land and additions on the property. Land Improvement
2025 $1,606 $141,224 $31,500 $109,724
2024 $1,560 $141,224 $31,500 $109,724
2023 $1,560 $138,794 $31,500 $107,294
2022 $1,569 $126,634 $28,700 $97,934
2021 $1,547 $96,011 $27,300 $68,711
2020 $1,621 $96,964 $21,000 $75,964
2019 $1,637 $89,358 $17,500 $71,858
2018 $1,632 $76,082 $15,750 $60,332
2017 $1,966 $76,002 $15,050 $60,952
2016 $1,550 $68,226 $15,050 $53,176
2015 $1,653 $58,804 $8,750 $50,054
2014 $2,805 $5,250 $5,250 $0
Source: Public Records

Agents Affiliated with this Home

  • Section Image
See All Agents

Map