3517 Greenly Ct Holland, MI 49424
Estimated Value: $233,000 - $325,000
--
Bed
1
Bath
1,164
Sq Ft
$223/Sq Ft
Est. Value
About This Home
This home is located at 3517 Greenly Ct, Holland, MI 49424 and is currently estimated at $259,686, approximately $223 per square foot. 3517 Greenly Ct is a home located in Ottawa County with nearby schools including Los Lagos Bilingual Academy, Macatawa Bay Middle School, and West Ottawa High School.
Ownership History
Date
Name
Owned For
Owner Type
Purchase Details
Closed on
Mar 4, 2016
Sold by
Woodbridge Management Consultants Llc
Bought by
Tibbe Jim
Current Estimated Value
Purchase Details
Closed on
Dec 11, 2007
Sold by
The Bank Of Holland
Bought by
Woodbridge Management Consultants Llc
Home Financials for this Owner
Home Financials are based on the most recent Mortgage that was taken out on this home.
Original Mortgage
$1,425,000
Interest Rate
6.3%
Mortgage Type
Seller Take Back
Create a Home Valuation Report for This Property
The Home Valuation Report is an in-depth analysis detailing your home's value as well as a comparison with similar homes in the area
Home Values in the Area
Average Home Value in this Area
Purchase History
| Date | Buyer | Sale Price | Title Company |
|---|---|---|---|
| Tibbe Jim | $10,000 | Lighthouse Title Inc | |
| Woodbridge Management Consultants Llc | -- | Lighthouse Title Inc | |
| Woodbridge Management Consultants Llc | -- | None Available |
Source: Public Records
Mortgage History
| Date | Status | Borrower | Loan Amount |
|---|---|---|---|
| Previous Owner | Woodbridge Management Consultants Llc | $1,425,000 |
Source: Public Records
Tax History Compared to Growth
Tax History
| Year | Tax Paid | Tax Assessment Tax Assessment Total Assessment is a certain percentage of the fair market value that is determined by local assessors to be the total taxable value of land and additions on the property. | Land | Improvement |
|---|---|---|---|---|
| 2025 | $3,046 | $109,600 | $0 | $0 |
| 2024 | $2,574 | $97,700 | $0 | $0 |
| 2023 | $2,469 | $82,000 | $0 | $0 |
| 2022 | $2,782 | $77,700 | $0 | $0 |
| 2021 | $2,698 | $69,800 | $0 | $0 |
| 2020 | $2,666 | $62,800 | $0 | $0 |
| 2019 | $2,621 | $43,600 | $0 | $0 |
| 2018 | $2,164 | $52,600 | $9,000 | $43,600 |
| 2017 | $2,121 | $49,600 | $0 | $0 |
| 2016 | $404 | $9,700 | $0 | $0 |
| 2015 | $397 | $8,200 | $0 | $0 |
| 2014 | $397 | $8,200 | $0 | $0 |
Source: Public Records
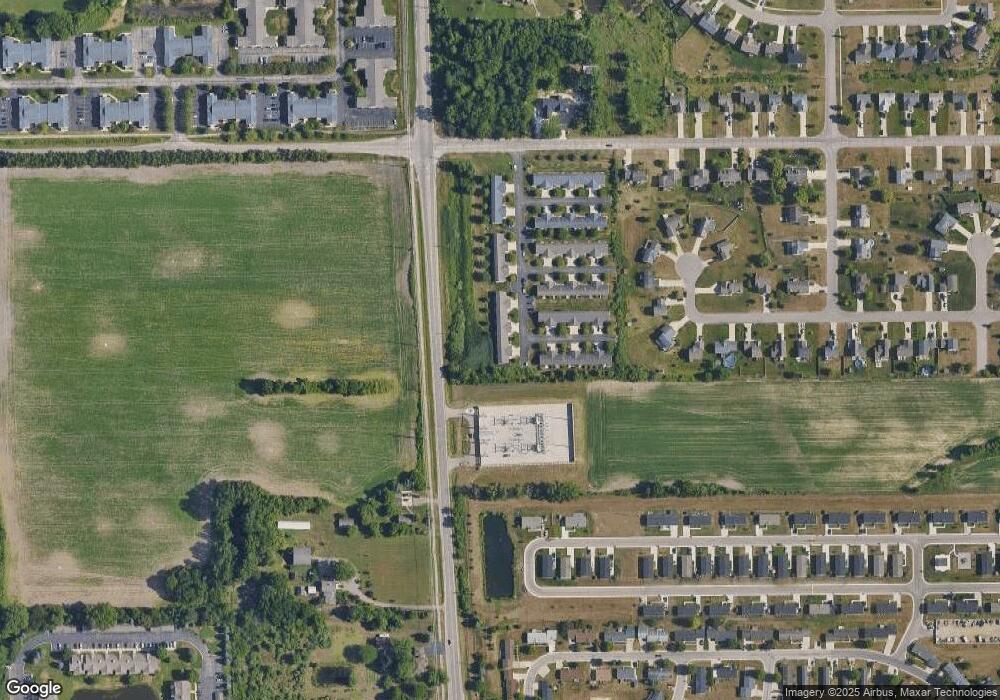
Map
Nearby Homes
- 11952 Bush Ct Unit 29
- 11953 Bush Ct Unit 23
- 3329 120th Ave
- 3707 Elm Ridge Dr
- 3236 Waverly Park
- 3717 Beeline Rd
- 3741 Elderberry Dr Unit Lot 221
- 3630 Tulipleaf Dr Unit Lot 241
- 3654 Tulipleaf Dr Unit Lot 244
- 11913 Smithfield Dr Unit 11
- 11985 Smithfield Dr Unit 1
- 3748 Elderberry Dr Unit Lot 256
- 3760 Elderberry Dr Unit Lot 257
- 11905 Smithfield Dr Unit 13
- 11981 Smithfield Dr Unit 2
- 11593 Greenly St
- 11948 Smithfield Dr Unit 46
- 11887 Quincy Meadow Dr
- 0 V/L Quincy St
- 12265 S Crystal Waters Dr Unit 6
- 3513 Greenly Ct
- 3521 Greenly Ct
- 3525 Greenly Ct
- 11966 Burning Bush Ct Unit 45
- 3529 Greenly Ct
- 11967 Burning Bush Ct Unit 39
- 3533 Greenly Ct
- 11958 Burning Bush Ct Unit 46
- 11959 Burning Bush Ct Unit 40
- 11951 Burning Bush Ct
- 11951 Burning Bush Ct Unit 41
- 3549 Greenly Ct Unit 20
- 11942 Burning Bush Ct Unit 48
- 11934 Burning Bush Ct Unit 49
- 11950 Burning Bush Ct Unit 47
- 11943 Burning Bush Ct
- 3553 Greenly Ct Unit 19
- 11968 Bush Ct Unit 27
- 11960 Bush Ct Unit 28
- 11935 Burning Bush Ct Unit 43