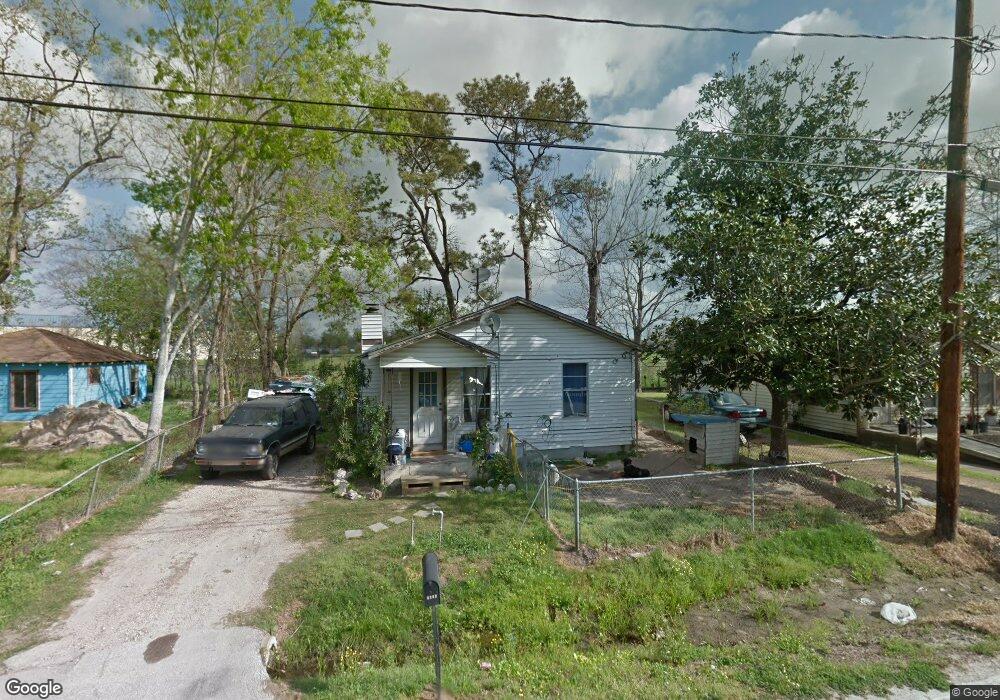
3517 Nuggent St Houston, TX 77093
East Aldine NeighborhoodEstimated Value: $114,401 - $180,000
2
Beds
1
Bath
1,008
Sq Ft
$141/Sq Ft
Est. Value
About This Home
This home is located at 3517 Nuggent St, Houston, TX 77093 and is currently estimated at $142,350, approximately $141 per square foot. 3517 Nuggent St is a home located in Harris County with nearby schools including Orange Grove Elementary School, Hambrick Middle School, and Macarthur Ninth Grade School.
Ownership History
Date
Name
Owned For
Owner Type
Purchase Details
Closed on
Oct 21, 2020
Sold by
Palacios Jaden and Palacios Hector M
Bought by
Diaz Juan Antonio
Current Estimated Value
Purchase Details
Closed on
Jul 5, 2016
Sold by
Palacios Janden and Palacios Hector M
Bought by
Resendez Garcia Juan Jose and Ruiz Glendida Resebdez
Purchase Details
Closed on
Jun 9, 2016
Sold by
Garcia Jaime Isaias
Bought by
Palacios Hector M
Purchase Details
Closed on
Jan 5, 2015
Sold by
Palacios Hector M
Bought by
Garcia Jaime Isaias and Garcia Eulalia
Purchase Details
Closed on
Jan 2, 2015
Sold by
Lopez-Noriega Jose Luis
Bought by
Palacios Hector M
Purchase Details
Closed on
Sep 15, 2014
Sold by
Propertys Dean D Martin
Bought by
Lopez Noriega Jose Luis
Purchase Details
Closed on
Aug 8, 2014
Sold by
Ponder James L and Ponder Etta O
Bought by
Ponder Etta O
Create a Home Valuation Report for This Property
The Home Valuation Report is an in-depth analysis detailing your home's value as well as a comparison with similar homes in the area
Home Values in the Area
Average Home Value in this Area
Purchase History
| Date | Buyer | Sale Price | Title Company |
|---|---|---|---|
| Diaz Juan Antonio | -- | None Listed On Document | |
| Resendez Garcia Juan Jose | -- | None Available | |
| Palacios Hector M | -- | None Available | |
| Garcia Jaime Isaias | -- | None Available | |
| Palacios Hector M | -- | None Available | |
| Lopez Noriega Jose Luis | -- | None Available | |
| Ponder Etta O | -- | None Available |
Source: Public Records
Mortgage History
| Date | Status | Borrower | Loan Amount |
|---|---|---|---|
| Closed | Lopez Noriega Jose Luis | $0 |
Source: Public Records
Tax History Compared to Growth
Tax History
| Year | Tax Paid | Tax Assessment Tax Assessment Total Assessment is a certain percentage of the fair market value that is determined by local assessors to be the total taxable value of land and additions on the property. | Land | Improvement |
|---|---|---|---|---|
| 2025 | $1,286 | $72,383 | $34,000 | $38,383 |
| 2024 | $1,286 | $72,383 | $34,000 | $38,383 |
| 2023 | $1,286 | $55,383 | $17,000 | $38,383 |
| 2022 | $822 | $39,965 | $17,000 | $22,965 |
| 2021 | $757 | $35,134 | $17,000 | $18,134 |
| 2020 | $798 | $35,134 | $17,000 | $18,134 |
| 2019 | $671 | $28,201 | $13,600 | $14,601 |
| 2018 | $260 | $18,102 | $5,950 | $12,152 |
| 2017 | $410 | $18,102 | $5,950 | $12,152 |
| 2016 | $410 | $18,102 | $5,950 | $12,152 |
| 2015 | $404 | $18,102 | $5,950 | $12,152 |
| 2014 | $404 | $18,102 | $5,950 | $12,152 |
Source: Public Records
Map
Nearby Homes
- 3804 Cedar Hill Ln
- 1904 Little York Rd
- 3418 Hopper Rd
- 4918 Langley Rd
- 1728 Little York Rd
- 4410 Shelton Rd
- 2817 Cromwell St
- 2636 Lone Oak Rd
- 3214 Brea Crest St
- 2629 Kowis St
- 11206 Eastex Fwy
- 4415 Mooney Rd
- 2915 Brea Crest St
- 4007 Wedgewood St
- 3111 Hartwick Rd
- 3202 Parker Rd
- 3709 Gager St
- 4509 Haywood St
- 2315 Langley Rd
- 2311 Warwick Rd
- 3521 Nuggent St
- 3513 Nuggent St
- 3525 Nuggent St
- 3518 Nuggent St
- 3601 Nuggent St
- 3505 Nuggent St
- 3522 Nuggent St
- 3510 Nuggent St
- 3506 Nuggent St
- 3602 Nuggent St
- 3605 Nuggent St
- 3513 Three Sisters St
- 3521 Three Sisters St
- 3606 Nuggent St
- 3606 Nuggent St
- 3525 Three Sisters St
- 0 Nuggent St
- 3505 Three Sisters St
- 3605 Three Sisters St
- 3613 Nuggent St