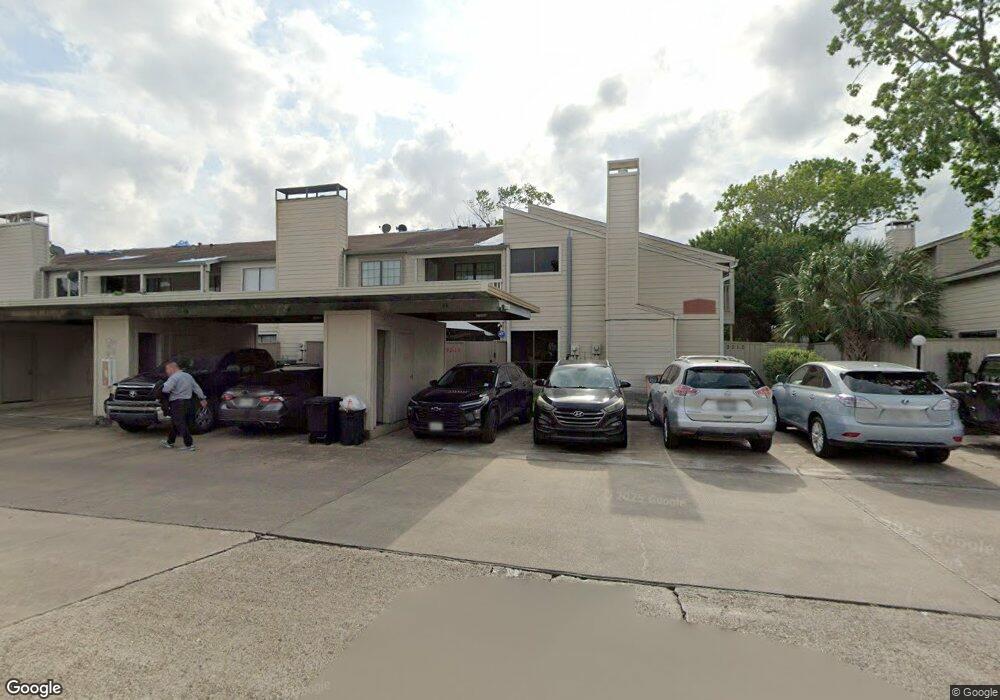
3517 Tanglewilde St Unit 3517 Houston, TX 77063
Mid West NeighborhoodEstimated Value: $135,239 - $154,000
3
Beds
3
Baths
1,402
Sq Ft
$102/Sq Ft
Est. Value
About This Home
This home is located at 3517 Tanglewilde St Unit 3517, Houston, TX 77063 and is currently estimated at $143,560, approximately $102 per square foot. 3517 Tanglewilde St Unit 3517 is a home located in Harris County with nearby schools including Emerson Elementary School, Paul Revere Middle School, and Wisdom High School.
Ownership History
Date
Name
Owned For
Owner Type
Purchase Details
Closed on
Jun 12, 2006
Sold by
Mokhtari Ahmad and Dodongeh Zahra
Bought by
Tellez Juan Martin
Current Estimated Value
Home Financials for this Owner
Home Financials are based on the most recent Mortgage that was taken out on this home.
Original Mortgage
$72,265
Outstanding Balance
$42,462
Interest Rate
6.56%
Mortgage Type
Fannie Mae Freddie Mac
Estimated Equity
$101,098
Purchase Details
Closed on
Jul 13, 1998
Sold by
Tran Pauline
Bought by
Mokhtari Ahmad
Home Financials for this Owner
Home Financials are based on the most recent Mortgage that was taken out on this home.
Original Mortgage
$31,500
Interest Rate
7.09%
Mortgage Type
Purchase Money Mortgage
Create a Home Valuation Report for This Property
The Home Valuation Report is an in-depth analysis detailing your home's value as well as a comparison with similar homes in the area
Home Values in the Area
Average Home Value in this Area
Purchase History
| Date | Buyer | Sale Price | Title Company |
|---|---|---|---|
| Tellez Juan Martin | -- | Charter Title Company | |
| Mokhtari Ahmad | -- | First American Title |
Source: Public Records
Mortgage History
| Date | Status | Borrower | Loan Amount |
|---|---|---|---|
| Open | Tellez Juan Martin | $72,265 | |
| Previous Owner | Mokhtari Ahmad | $31,500 |
Source: Public Records
Tax History Compared to Growth
Tax History
| Year | Tax Paid | Tax Assessment Tax Assessment Total Assessment is a certain percentage of the fair market value that is determined by local assessors to be the total taxable value of land and additions on the property. | Land | Improvement |
|---|---|---|---|---|
| 2025 | $1,330 | $117,043 | $22,238 | $94,805 |
| 2024 | $1,330 | $131,083 | $24,906 | $106,177 |
| 2023 | $1,330 | $131,083 | $24,906 | $106,177 |
| 2022 | $2,459 | $119,116 | $22,632 | $96,484 |
| 2021 | $2,366 | $101,507 | $19,286 | $82,221 |
| 2020 | $2,313 | $95,502 | $18,145 | $77,357 |
| 2019 | $2,288 | $91,104 | $17,310 | $73,794 |
| 2018 | $1,371 | $85,193 | $16,187 | $69,006 |
| 2017 | $1,890 | $85,193 | $16,187 | $69,006 |
| 2016 | $1,718 | $80,979 | $15,386 | $65,593 |
| 2015 | $981 | $71,638 | $13,611 | $58,027 |
| 2014 | $981 | $56,157 | $10,670 | $45,487 |
Source: Public Records
Map
Nearby Homes
- 3605 Tanglewilde St Unit 3605
- 3615 Tanglewilde St Unit 3615
- 9556 Windswept Ln Unit 9556
- 9527 Windswept Ln Unit 9527
- 9538 Skyline Dr
- 9506 Pagewood Ln Unit 9506
- 3752 Tanglewilde St Unit B3
- 3768 Tanglewilde St Unit J5
- 3764 Tanglewilde St Unit 7
- 3754 Tanglewilde St Unit C3
- 3754 Tanglewilde St Unit 9
- 3875 Tanglewilde St Unit 3875
- 9519 Pagewood Ln Unit 9519
- 9671 Judalon Ln
- 9431 Pagewood Ln
- 9433 Pagewood Ln
- 3800 Tanglewilde St Unit 109
- 3800 Tanglewilde St Unit 803
- 3800 Tanglewilde St Unit 605
- 3800 Tanglewilde St Unit 607
- 3519 Tanglewilde St Unit 3519
- 3507 Tanglewilde St Unit 3507
- 3521 Tanglewilde St Unit 3521
- 3505 Tanglewilde St Unit 3505
- 3509 Tanglewilde St Unit 3509
- 3515 Tanglewilde St Unit 3515
- 3523 Tanglewilde St Unit 3523
- 3503 Tanglewilde St Unit 3503
- 3511 Tanglewilde St Unit 3511
- 3513 Tanglewilde St Unit 3513
- 3501 Tanglewilde St Unit 3501
- 3613 Tanglewilde St Unit 3613
- 9564 Windswept Ln Unit 9564
- 3601 Tanglewilde St Unit 3601
- 9568 Windswept Ln Unit 9568
- 9570 Windswept Ln Unit 9570
- 9562 Windswept Ln Unit 9562
- 9572 Windswept Ln Unit 9572
- 9592 Windswept Ln Unit 9592
- 9590 Windswept Ln Unit 9590