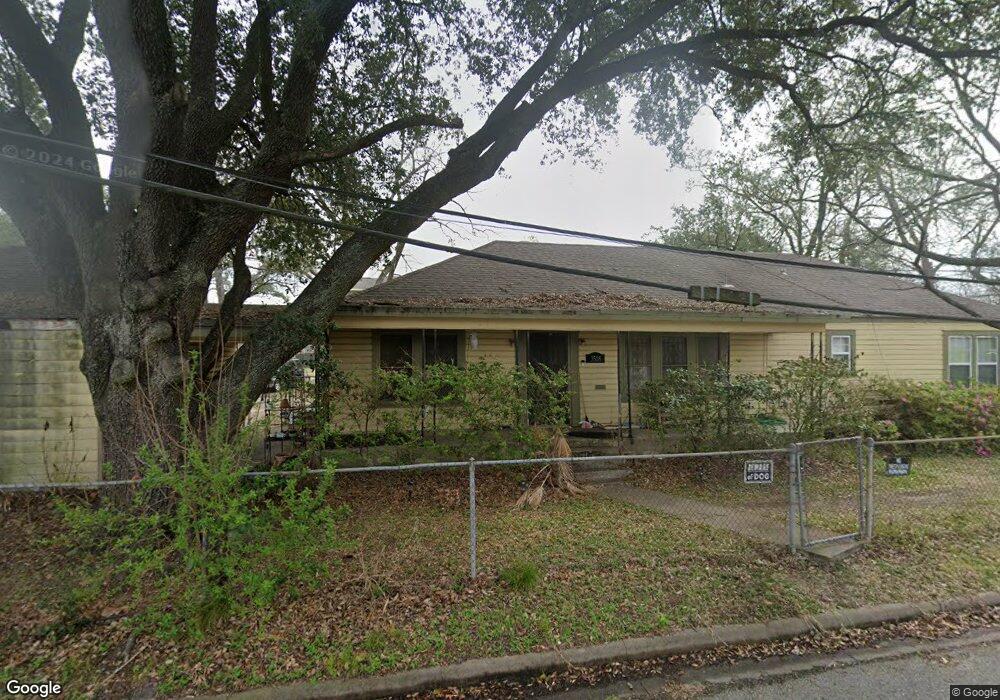
3518 Cortlandt St Houston, TX 77018
Independence Heights NeighborhoodEstimated Value: $269,280 - $434,000
2
Beds
1
Bath
1,986
Sq Ft
$167/Sq Ft
Est. Value
About This Home
This home is located at 3518 Cortlandt St, Houston, TX 77018 and is currently estimated at $331,820, approximately $167 per square foot. 3518 Cortlandt St is a home located in Harris County with nearby schools including Burrus Elementary School, Hamilton Middle, and Booker T Washington Sr High.
Ownership History
Date
Name
Owned For
Owner Type
Purchase Details
Closed on
Dec 31, 2003
Sold by
Cormier Dorothy J
Bought by
Cormier Patrick Adam
Current Estimated Value
Purchase Details
Closed on
Apr 14, 1998
Sold by
Hud
Bought by
Gonzalez Roberto and Gonzalez Maria
Home Financials for this Owner
Home Financials are based on the most recent Mortgage that was taken out on this home.
Original Mortgage
$50,573
Outstanding Balance
$9,710
Interest Rate
7.23%
Mortgage Type
FHA
Estimated Equity
$322,110
Create a Home Valuation Report for This Property
The Home Valuation Report is an in-depth analysis detailing your home's value as well as a comparison with similar homes in the area
Home Values in the Area
Average Home Value in this Area
Purchase History
| Date | Buyer | Sale Price | Title Company |
|---|---|---|---|
| Cormier Patrick Adam | -- | -- | |
| Gonzalez Roberto | $50,991 | -- |
Source: Public Records
Mortgage History
| Date | Status | Borrower | Loan Amount |
|---|---|---|---|
| Open | Gonzalez Roberto | $50,573 |
Source: Public Records
Tax History Compared to Growth
Tax History
| Year | Tax Paid | Tax Assessment Tax Assessment Total Assessment is a certain percentage of the fair market value that is determined by local assessors to be the total taxable value of land and additions on the property. | Land | Improvement |
|---|---|---|---|---|
| 2025 | $1,603 | $221,514 | $175,000 | $46,514 |
| 2024 | $1,603 | $202,661 | $175,000 | $27,661 |
| 2023 | $1,603 | $224,952 | $175,000 | $49,952 |
| 2022 | $2,682 | $193,132 | $150,000 | $43,132 |
| 2021 | $2,581 | $170,425 | $125,000 | $45,425 |
| 2020 | $2,438 | $154,828 | $125,000 | $29,828 |
| 2019 | $2,316 | $148,101 | $109,375 | $38,726 |
| 2018 | $1,391 | $128,403 | $91,875 | $36,528 |
| 2017 | $1,913 | $110,028 | $73,500 | $36,528 |
| 2016 | $1,739 | $85,528 | $49,000 | $36,528 |
| 2015 | $995 | $74,768 | $49,000 | $25,768 |
| 2014 | $995 | $56,830 | $30,625 | $26,205 |
Source: Public Records
Map
Nearby Homes