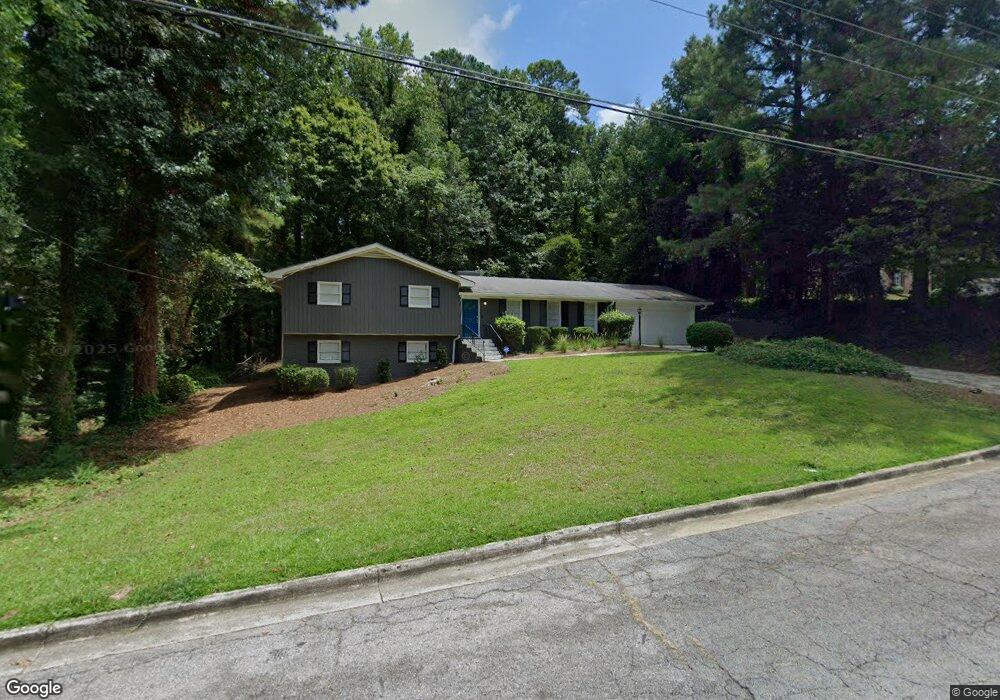
3518 Cumberland Rd Atlanta, GA 30344
Estimated Value: $267,495 - $307,000
4
Beds
3
Baths
1,483
Sq Ft
$197/Sq Ft
Est. Value
About This Home
This home is located at 3518 Cumberland Rd, Atlanta, GA 30344 and is currently estimated at $291,874, approximately $196 per square foot. 3518 Cumberland Rd is a home located in Fulton County with nearby schools including Asa Hilliard G. Elementary School, Woodland Middle School, and Tri-Cities High School.
Ownership History
Date
Name
Owned For
Owner Type
Purchase Details
Closed on
Sep 2, 2020
Sold by
Victoria 138 Llc
Bought by
Carter Betty L and Carter Jimmy L
Current Estimated Value
Purchase Details
Closed on
Feb 19, 2019
Sold by
Edwards Darrell William
Bought by
Victoria 138 Llc
Home Financials for this Owner
Home Financials are based on the most recent Mortgage that was taken out on this home.
Original Mortgage
$124,750
Interest Rate
4.4%
Mortgage Type
New Conventional
Purchase Details
Closed on
Oct 4, 2018
Sold by
Edwards Andrew
Bought by
Edwards Darrell William
Purchase Details
Closed on
Jul 20, 2016
Sold by
William Darrell
Bought by
Edwards Darrell William and Edwards Shana Phillips
Purchase Details
Closed on
Dec 20, 2013
Sold by
Franklyn Lucille E
Bought by
Franklyn Lucille E and Edwards Darrell W
Purchase Details
Closed on
Mar 13, 2012
Sold by
Phillips Bettie R
Bought by
Franklin Lucille E
Create a Home Valuation Report for This Property
The Home Valuation Report is an in-depth analysis detailing your home's value as well as a comparison with similar homes in the area
Home Values in the Area
Average Home Value in this Area
Purchase History
| Date | Buyer | Sale Price | Title Company |
|---|---|---|---|
| Carter Betty L | -- | -- | |
| Victoria 138 Llc | -- | -- | |
| Victoria 138 Llc | $78,000 | -- | |
| Edwards Darrell William | -- | -- | |
| Edwards Darrell William | -- | -- | |
| Edwards Darrell William | -- | -- | |
| Franklyn Lucille E | -- | -- | |
| Franklin Lucille E | -- | -- |
Source: Public Records
Mortgage History
| Date | Status | Borrower | Loan Amount |
|---|---|---|---|
| Previous Owner | Victoria 138 Llc | $124,750 |
Source: Public Records
Tax History Compared to Growth
Tax History
| Year | Tax Paid | Tax Assessment Tax Assessment Total Assessment is a certain percentage of the fair market value that is determined by local assessors to be the total taxable value of land and additions on the property. | Land | Improvement |
|---|---|---|---|---|
| 2025 | $110 | $120,280 | $24,840 | $95,440 |
| 2023 | $2,238 | $79,280 | $25,760 | $53,520 |
| 2022 | $206 | $79,280 | $25,760 | $53,520 |
| 2021 | $2,772 | $65,920 | $15,720 | $50,200 |
| 2020 | $2,350 | $54,320 | $9,760 | $44,560 |
| 2019 | $827 | $53,320 | $9,560 | $43,760 |
| 2018 | $1,470 | $52,080 | $9,360 | $42,720 |
| 2017 | $600 | $20,560 | $6,720 | $13,840 |
| 2016 | $600 | $20,560 | $6,720 | $13,840 |
| 2015 | $1,021 | $20,560 | $6,720 | $13,840 |
| 2014 | $630 | $20,560 | $6,720 | $13,840 |
Source: Public Records
Map
Nearby Homes
- 3528 Cumberland Rd
- 3014 Redwine Rd
- 3024 Redwine Rd
- 3004 Redwine Rd
- 3538 Cumberland Rd
- 3521 Cumberland Rd
- 3040 Redwine Rd
- 2994 Redwine Rd
- 3531 Cumberland Rd
- 3548 Cumberland Rd
- 3541 Cumberland Rd
- 3050 Redwine Rd
- 3535 Redwine Ct
- 2984 Redwine Rd
- 3005 Redwine Rd
- 3015 Redwine Rd
- 3027 Redwine Rd
- 3545 Redwine Ct
- 3551 Cumberland Rd Unit 1
- 3060 Redwine Rd