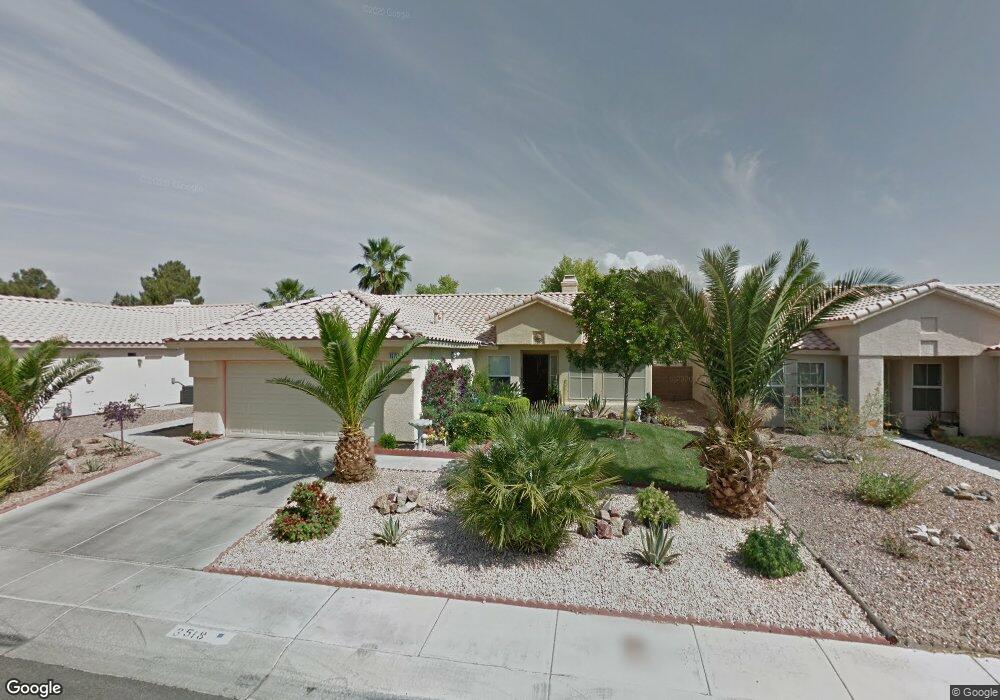
3518 Freestone Ln North Las Vegas, NV 89032
Cheyenne NeighborhoodEstimated Value: $391,334 - $430,000
3
Beds
2
Baths
1,456
Sq Ft
$278/Sq Ft
Est. Value
About This Home
This home is located at 3518 Freestone Ln, North Las Vegas, NV 89032 and is currently estimated at $405,334, approximately $278 per square foot. 3518 Freestone Ln is a home located in Clark County with nearby schools including Lucile Bruner Elementary School, Theron L Swainston Middle School, and Cheyenne High School.
Ownership History
Date
Name
Owned For
Owner Type
Purchase Details
Closed on
Jun 29, 2005
Sold by
Aden Jeffrey A
Bought by
Barut Pat A and Stephens Diane E
Current Estimated Value
Home Financials for this Owner
Home Financials are based on the most recent Mortgage that was taken out on this home.
Original Mortgage
$204,000
Interest Rate
4.96%
Mortgage Type
Purchase Money Mortgage
Purchase Details
Closed on
Apr 20, 2001
Sold by
Aden Jeffrey A and Aden Jeffrey
Bought by
Aden Jeffrey A
Home Financials for this Owner
Home Financials are based on the most recent Mortgage that was taken out on this home.
Original Mortgage
$98,200
Interest Rate
6.98%
Purchase Details
Closed on
Sep 14, 1995
Sold by
Aden Kathie
Bought by
Aden Jeffrey
Purchase Details
Closed on
Dec 20, 1993
Sold by
Pageantry I Ltd Partnership
Bought by
Aden Jeffrey A and Aden Kathie
Home Financials for this Owner
Home Financials are based on the most recent Mortgage that was taken out on this home.
Original Mortgage
$105,850
Interest Rate
7.2%
Mortgage Type
FHA
Create a Home Valuation Report for This Property
The Home Valuation Report is an in-depth analysis detailing your home's value as well as a comparison with similar homes in the area
Home Values in the Area
Average Home Value in this Area
Purchase History
| Date | Buyer | Sale Price | Title Company |
|---|---|---|---|
| Barut Pat A | $258,500 | National Title Company | |
| Aden Jeffrey A | -- | Fidelity National Title | |
| Aden Jeffrey | -- | -- | |
| Aden Jeffrey A | $106,500 | Nevada Title Company |
Source: Public Records
Mortgage History
| Date | Status | Borrower | Loan Amount |
|---|---|---|---|
| Previous Owner | Barut Pat A | $204,000 | |
| Previous Owner | Aden Jeffrey A | $98,200 | |
| Previous Owner | Aden Jeffrey A | $105,850 |
Source: Public Records
Tax History Compared to Growth
Tax History
| Year | Tax Paid | Tax Assessment Tax Assessment Total Assessment is a certain percentage of the fair market value that is determined by local assessors to be the total taxable value of land and additions on the property. | Land | Improvement |
|---|---|---|---|---|
| 2025 | $240 | $79,972 | $28,000 | $51,972 |
| 2024 | $237 | $79,972 | $28,000 | $51,972 |
| 2023 | $237 | $80,026 | $30,450 | $49,576 |
| 2022 | $473 | $70,291 | $24,850 | $45,441 |
| 2021 | $1,153 | $64,401 | $21,000 | $43,401 |
| 2020 | $553 | $64,197 | $21,000 | $43,197 |
| 2019 | $548 | $60,262 | $17,500 | $42,762 |
| 2018 | $550 | $54,566 | $13,300 | $41,266 |
| 2017 | $1,257 | $54,884 | $12,950 | $41,934 |
| 2016 | $464 | $49,265 | $10,500 | $38,765 |
| 2015 | $556 | $37,044 | $7,000 | $30,044 |
| 2014 | $966 | $27,938 | $5,250 | $22,688 |
Source: Public Records
Map
Nearby Homes
- 3505 Benson Ln
- 3910 Cheryl Clay Way
- 3938 Redfield Ave
- 3107 Atwater Dr
- 3784 Nerine Pass Way
- 4002 Extenso Dr
- 4013 Extenso Dr
- Bellevue NextGen Plan at Simmance
- Skyland Plan at Simmance
- 2801 Simmons Creek Ct
- 3629 Newton Falls St Unit 4
- 3820 Alpine Track Ave
- 3937 Jamison Park Ln
- 4115 Tatum Ct
- 3809 Alpine Track Ave
- 3930 Burma Rd
- 3614 Newton Falls St
- 4448 Whelk Place
- 3609 Simmons St
- 4108 Dove Creek Rd
- 3522 Freestone Ln
- 3514 Freestone Ln
- 3517 Sockeye Ln
- 3604 Freestone Ln
- 3521 Sockeye Ln
- 3513 Sockeye Ln
- 3517 Freestone Ln
- 3601 Sockeye Ln
- 3509 Sockeye Ln
- 3521 Freestone Ln
- 3513 Freestone Ln
- 3608 Freestone Ln
- 3506 Freestone Ln
- 3506 Freestone Ln Unit n/a
- 3603 Freestone Ln
- 3509 Freestone Ln
- 3605 Sockeye Ln
- 3505 Sockeye Ln
- 3607 Freestone Ln
- 3505 Freestone Ln