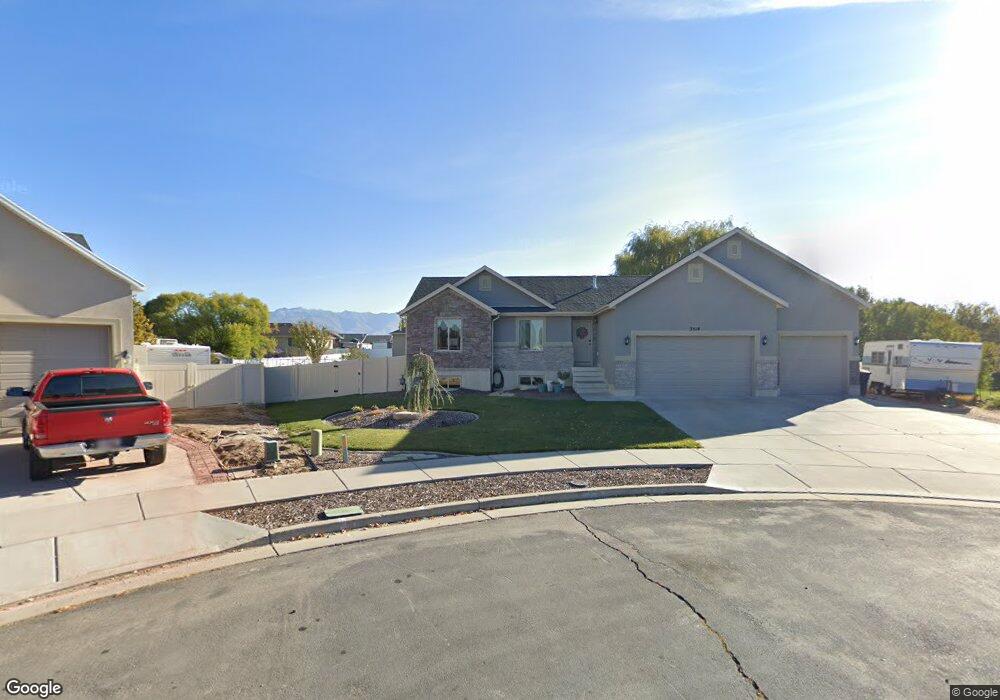
3518 W 1450 N West Point, UT 84015
Estimated Value: $541,000 - $592,000
3
Beds
2
Baths
2,850
Sq Ft
$200/Sq Ft
Est. Value
About This Home
This home is located at 3518 W 1450 N, West Point, UT 84015 and is currently estimated at $569,562, approximately $199 per square foot. 3518 W 1450 N is a home located in Davis County with nearby schools including West Point School, West Point Junior High School, and Syracuse High School.
Ownership History
Date
Name
Owned For
Owner Type
Purchase Details
Closed on
Dec 4, 2020
Sold by
Bolinder Brandon
Bought by
Bolinder Brandon Jay
Current Estimated Value
Home Financials for this Owner
Home Financials are based on the most recent Mortgage that was taken out on this home.
Original Mortgage
$315,000
Outstanding Balance
$280,305
Interest Rate
2.8%
Mortgage Type
New Conventional
Estimated Equity
$289,257
Purchase Details
Closed on
Mar 26, 2013
Sold by
Love Jared K
Bought by
Bolinder Brandon
Home Financials for this Owner
Home Financials are based on the most recent Mortgage that was taken out on this home.
Original Mortgage
$221,815
Interest Rate
3.37%
Mortgage Type
FHA
Purchase Details
Closed on
Apr 17, 2012
Sold by
Bartholomew Lane Llc
Bought by
Love Jared K
Purchase Details
Closed on
Apr 6, 2009
Sold by
Bretwood Company Inc
Bought by
Bartholomew Lane Llc
Create a Home Valuation Report for This Property
The Home Valuation Report is an in-depth analysis detailing your home's value as well as a comparison with similar homes in the area
Home Values in the Area
Average Home Value in this Area
Purchase History
| Date | Buyer | Sale Price | Title Company |
|---|---|---|---|
| Bolinder Brandon Jay | -- | Wasatch Title Insurance | |
| Bolinder Brandon | -- | First American Title | |
| Love Jared K | -- | Security Title Of Davis | |
| Bartholomew Lane Llc | -- | Security Title Of Davis Co |
Source: Public Records
Mortgage History
| Date | Status | Borrower | Loan Amount |
|---|---|---|---|
| Open | Bolinder Brandon Jay | $315,000 | |
| Closed | Bolinder Brandon | $221,815 |
Source: Public Records
Tax History Compared to Growth
Tax History
| Year | Tax Paid | Tax Assessment Tax Assessment Total Assessment is a certain percentage of the fair market value that is determined by local assessors to be the total taxable value of land and additions on the property. | Land | Improvement |
|---|---|---|---|---|
| 2025 | $3,075 | $288,200 | $119,792 | $168,408 |
| 2024 | $2,951 | $277,750 | $107,841 | $169,909 |
| 2023 | $2,737 | $474,000 | $134,796 | $339,204 |
| 2022 | $3,070 | $290,950 | $70,221 | $220,729 |
| 2021 | $2,856 | $405,000 | $109,313 | $295,687 |
| 2020 | $2,444 | $342,000 | $91,906 | $250,094 |
| 2019 | $2,370 | $327,000 | $89,145 | $237,855 |
| 2018 | $2,191 | $298,000 | $88,985 | $209,015 |
| 2016 | $2,044 | $146,245 | $29,946 | $116,299 |
| 2015 | $1,960 | $132,880 | $29,946 | $102,934 |
| 2014 | $1,728 | $118,788 | $29,946 | $88,842 |
| 2013 | -- | $83,338 | $28,998 | $54,340 |
Source: Public Records
Map
Nearby Homes
- 3168 W 1300 N
- 3892 W 1450 N
- 2413 N Eurasian Crane Rd
- 2959 W 1300 N
- 4061 W 1250 N Unit 1250
- 1172 N 3000 W
- 2921 W 1300 N
- 3941 W 1800 N
- 1124 N 4150 W
- 3918 W 825 N Unit WF6
- 3932 W 825 N Unit WF5
- 2118 Snowy Crane Dr
- 4469 W 1000 N Unit 120
- 4302 W 1550 N
- 2816 W 960 N
- Torino Farmhouse Plan at Cranefield Estates
- 1700 Farmhouse Plan at Cranefield Estates - Estates Collection
- 2000 Traditional Plan at Cranefield Estates - Estates Collection
- Murano Traditional Plan at Cranefield Estates - Estates Collection
- 2400 Farmhouse Plan at Cranefield Estates - Estates Collection
- 3521 W 1450 N
- 3522 W 1450 N
- 1441 N 3455 W
- 1441 N 3455 W Unit 7
- 3534 W 1450 N
- 3533 W 1450 N
- 1463 N 3455 W
- 1463 N 3455 W Unit 8
- 1429 N 3455 W
- 1429 N 3455 W Unit 6
- 3524 W 1400 N
- 1407 N 3455 W
- 1407 N 3455 W Unit 5
- 3501 W 1500 N
- 3517 W 1500 N
- 3546 W 1450 N
- 3547 W 1450 N
- 3536 W 1400 N
- 3529 W 1500 N
- 1494 N 3455 W Unit 23