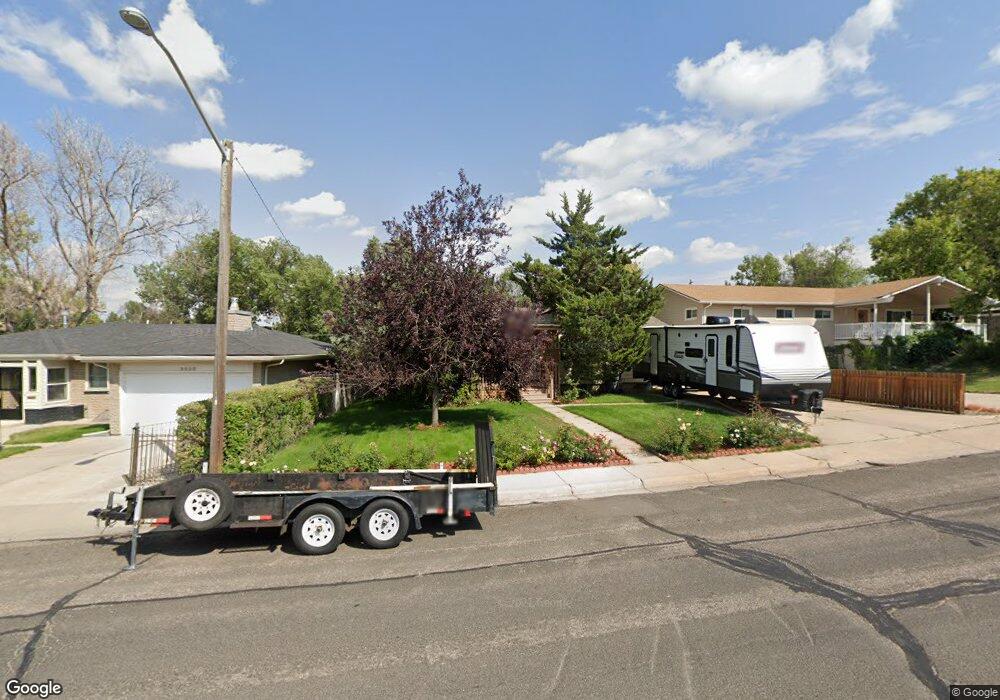
3519 Concord Rd Cheyenne, WY 82001
Estimated Value: $371,000 - $399,135
5
Beds
2
Baths
1,264
Sq Ft
$304/Sq Ft
Est. Value
About This Home
This home is located at 3519 Concord Rd, Cheyenne, WY 82001 and is currently estimated at $384,534, approximately $304 per square foot. 3519 Concord Rd is a home located in Laramie County with nearby schools including Henderson Elementary School, Carey Junior High School, and East High School.
Ownership History
Date
Name
Owned For
Owner Type
Purchase Details
Closed on
Aug 22, 2017
Sold by
Stewart Christopher L and Wertz Sherri M
Bought by
Stewart Christopher L and Stewart Sherri M
Current Estimated Value
Home Financials for this Owner
Home Financials are based on the most recent Mortgage that was taken out on this home.
Original Mortgage
$135,673
Outstanding Balance
$72,460
Interest Rate
3.92%
Mortgage Type
Future Advance Clause Open End Mortgage
Estimated Equity
$312,074
Purchase Details
Closed on
Sep 24, 2009
Sold by
Couch James H and Couch Gonul
Bought by
Stewart Christopher L and Wertz Sherri M
Home Financials for this Owner
Home Financials are based on the most recent Mortgage that was taken out on this home.
Original Mortgage
$164,957
Interest Rate
5.36%
Mortgage Type
FHA
Create a Home Valuation Report for This Property
The Home Valuation Report is an in-depth analysis detailing your home's value as well as a comparison with similar homes in the area
Home Values in the Area
Average Home Value in this Area
Purchase History
| Date | Buyer | Sale Price | Title Company |
|---|---|---|---|
| Stewart Christopher L | -- | None Available | |
| Stewart Christopher L | -- | None Available |
Source: Public Records
Mortgage History
| Date | Status | Borrower | Loan Amount |
|---|---|---|---|
| Open | Stewart Christopher L | $135,673 | |
| Closed | Stewart Christopher L | $164,957 |
Source: Public Records
Tax History Compared to Growth
Tax History
| Year | Tax Paid | Tax Assessment Tax Assessment Total Assessment is a certain percentage of the fair market value that is determined by local assessors to be the total taxable value of land and additions on the property. | Land | Improvement |
|---|---|---|---|---|
| 2025 | $2,354 | $26,054 | $3,285 | $22,769 |
| 2024 | $2,354 | $33,284 | $4,380 | $28,904 |
| 2023 | $2,380 | $33,664 | $4,380 | $29,284 |
| 2022 | $2,041 | $28,279 | $4,380 | $23,899 |
| 2021 | $1,936 | $26,762 | $4,380 | $22,382 |
| 2020 | $1,702 | $23,591 | $4,380 | $19,211 |
| 2019 | $1,540 | $21,333 | $4,380 | $16,953 |
| 2018 | $1,382 | $19,321 | $4,037 | $15,284 |
| 2017 | $1,372 | $19,008 | $4,037 | $14,971 |
| 2016 | $1,288 | $17,834 | $3,829 | $14,005 |
| 2015 | $1,197 | $16,567 | $3,829 | $12,738 |
| 2014 | $1,129 | $15,528 | $3,829 | $11,699 |
Source: Public Records
Map
Nearby Homes
- 3529 Concord Rd
- 1702 Newton Dr
- 3561 Boston Rd
- 3628 Amherst Rd
- 1813 Newton Dr
- 1813 Andover Dr
- 1801 Milton Dr
- 1731 E Pershing Blvd
- 1751 E Pershing Blvd
- 3333 Duff Ave
- 3700 Essex Rd
- 1408 E 22nd St
- 1958 Newton Dr
- 1808 E 21st St
- 1610 E 20th St
- 3444 Dover Rd
- Lot 1 E Phipps Ave
- TBD Charles St
- TBD E Lincolnway
- 1323 E 19th St Unit 1-4
- 3515 Concord Rd
- 3533 Concord Rd
- 1747 Newton Dr
- 1700 Oxford Dr
- 1743 Newton Dr
- 3541 Concord Rd
- 1706 Oxford Dr
- 1751 Newton Dr
- 1712 Oxford Dr
- 3520 Concord Rd
- 3526 Concord Rd
- 3545 Concord Rd
- 3514 Concord Rd
- 3532 Concord Rd
- 1628 Oxford Dr
- 1739 Newton Dr
- 3538 Concord Rd
- 1718 Oxford Dr
- 1622 Oxford Dr
- 1701 Newton Dr