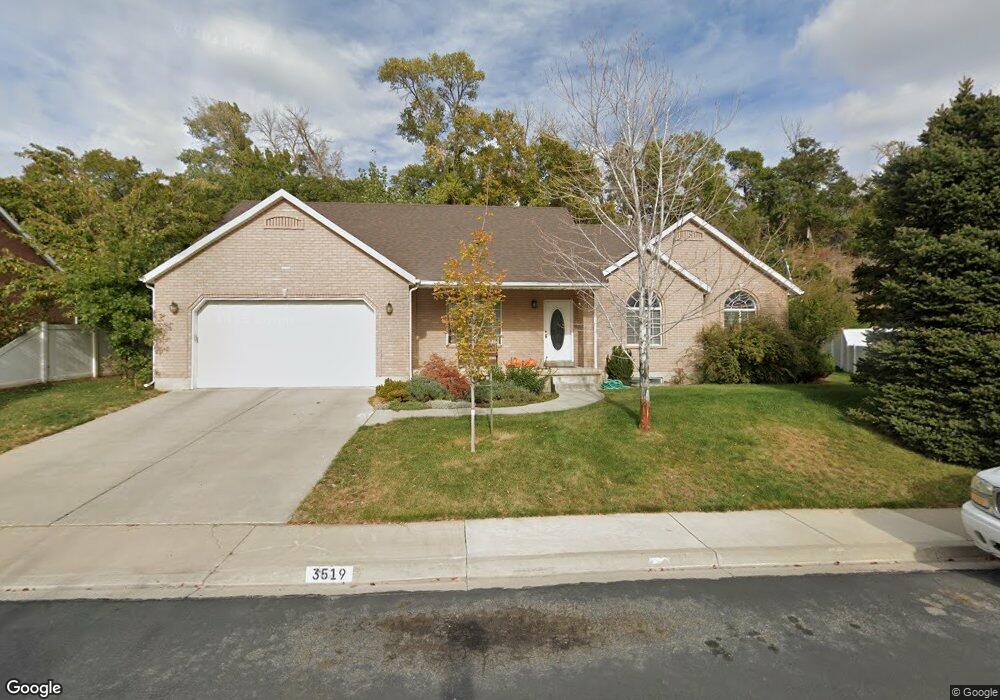
3519 Fairway Cir Spanish Fork, UT 84660
Estimated Value: $544,730 - $622,000
3
Beds
2
Baths
3,357
Sq Ft
$171/Sq Ft
Est. Value
About This Home
This home is located at 3519 Fairway Cir, Spanish Fork, UT 84660 and is currently estimated at $572,683, approximately $170 per square foot. 3519 Fairway Cir is a home located in Utah County with nearby schools including Spanish Oaks Elementary School, Diamond Fork Junior High School, and Mapleton Junior High School.
Ownership History
Date
Name
Owned For
Owner Type
Purchase Details
Closed on
Oct 17, 2002
Sold by
Warnick Karl F
Bought by
Warnick Karl F and Warnick Shauna J
Current Estimated Value
Home Financials for this Owner
Home Financials are based on the most recent Mortgage that was taken out on this home.
Original Mortgage
$152,000
Outstanding Balance
$63,212
Interest Rate
6.05%
Estimated Equity
$509,471
Purchase Details
Closed on
Jul 18, 2000
Sold by
Walpole Clark K and Walpole Cindy L
Bought by
Warnick Karl F and Warnick Shauna J
Home Financials for this Owner
Home Financials are based on the most recent Mortgage that was taken out on this home.
Original Mortgage
$170,050
Interest Rate
8.37%
Purchase Details
Closed on
May 21, 1999
Sold by
Whiting Brent A and Whiting Laurie
Bought by
Walpole Clark K and Walpole Cindy L
Purchase Details
Closed on
May 6, 1999
Sold by
Fairway Ventures Lc
Bought by
Walpole Clark K and Walpole Cindy L
Create a Home Valuation Report for This Property
The Home Valuation Report is an in-depth analysis detailing your home's value as well as a comparison with similar homes in the area
Home Values in the Area
Average Home Value in this Area
Purchase History
| Date | Buyer | Sale Price | Title Company |
|---|---|---|---|
| Warnick Karl F | -- | Wasatch Land & Title | |
| Warnick Karl F | -- | Wasatch Land & Title | |
| Warnick Karl F | -- | Pro Title & Escrow Inc | |
| Walpole Clark K | -- | -- | |
| Walpole Clark K | -- | First American Title Co |
Source: Public Records
Mortgage History
| Date | Status | Borrower | Loan Amount |
|---|---|---|---|
| Open | Warnick Karl F | $152,000 | |
| Closed | Warnick Karl F | $170,050 |
Source: Public Records
Tax History Compared to Growth
Tax History
| Year | Tax Paid | Tax Assessment Tax Assessment Total Assessment is a certain percentage of the fair market value that is determined by local assessors to be the total taxable value of land and additions on the property. | Land | Improvement |
|---|---|---|---|---|
| 2025 | $2,535 | $269,610 | $182,100 | $308,100 |
| 2024 | $2,535 | $261,305 | $0 | $0 |
| 2023 | $2,613 | $269,665 | $0 | $0 |
| 2022 | $2,606 | $263,725 | $0 | $0 |
| 2021 | $2,256 | $365,200 | $108,700 | $256,500 |
| 2020 | $2,096 | $329,900 | $98,800 | $231,100 |
| 2019 | $1,928 | $319,300 | $93,300 | $226,000 |
| 2018 | $1,870 | $299,300 | $90,900 | $208,400 |
| 2017 | $1,849 | $159,115 | $0 | $0 |
| 2016 | $1,597 | $135,630 | $0 | $0 |
| 2015 | $1,522 | $127,655 | $0 | $0 |
| 2014 | $1,357 | $114,235 | $0 | $0 |
Source: Public Records
Map
Nearby Homes
- 3488 E Fairway Ln
- 3657 E 1500 S
- 1414 S 3600 E
- 3575 E River Bottoms Rd
- 1366 S 3640 E
- 1501 S 3750 E
- 1465 S 3750 E
- 3194 E Canyon Meadows Dr Unit 211
- 3182 E Canyon Meadows Dr Unit 212
- 3197 E 1000 S
- 3145 E 1000 S Unit 301
- 3103 E 1000 S Unit 303
- 3176 E Canyon Meadows Dr
- 3176 E Canyon Meadows Dr Unit 213
- 4804 Alder Dr Unit 116
- 4655 Alder Dr Unit H201
- 4655 Alder Dr Unit H202
- 4655 Alder Dr Unit H204
- 4655 Alder Dr Unit H304
- 4655 Alder Dr Unit H301
- 3523 Fairway Cir
- 3517 Fairway Cir
- 1652 Fairway Cir Unit 29
- 3509 Fairway Cir Unit 28
- 3526 Fairway Cir
- 3528 Fairway Cir
- 3525 Fairway Cir
- 3518 Fairway Cir
- 3511 Fairway Cir
- 3512 Fairway Cir
- 3512 E Fairway Cir S
- 3514 Fairway Cir
- 3521 E Fairway Ln
- 3521 Fairway Ln
- 3521 Fairway Ln
- 3513 E Fairway Ln
- 3527 Fairway Cir
- 3513 Fairway Ln
- 3513 Fairway Ln Unit 13
- 3529 Fairway Ln