
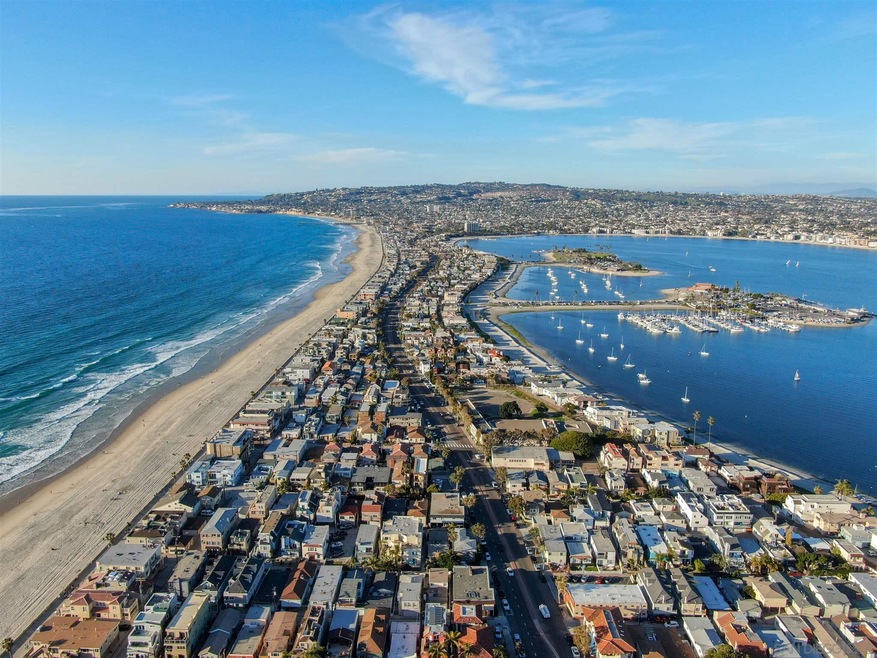
3519 Ocean Front Walk Unit A San Diego, CA 92109
Mission Beach Neighborhood
4
Beds
3
Baths
1,800
Sq Ft
$350/mo
HOA Fee
Highlights
- Private Yard
- 2 Car Attached Garage
- Gated Home
- Pacific Beach Elementary School Rated A-
- Laundry closet
- Level Lot
About This Home
As of March 2021This beach front home is got it all! 2 Master suites plus 2 more bedrooms for a total of 4 beds and 3 baths. New bamboo flooring throughout. Custom shutter blinds. LOCATION LOCATION LOCATION!
Last Agent to Sell the Property
HomeSmart Realty West License #01336778 Listed on: 01/30/2021
Townhouse Details
Home Type
- Townhome
Est. Annual Taxes
- $31,907
Year Built
- Built in 1980
Lot Details
- Gated Home
- Partially Fenced Property
- Private Yard
HOA Fees
- $350 Monthly HOA Fees
Parking
- 2 Car Attached Garage
- Driveway
Home Design
- Composition Roof
- Stucco Exterior
Interior Spaces
- 1,800 Sq Ft Home
- 3-Story Property
Kitchen
- Electric Oven
- Electric Range
- Dishwasher
- Disposal
Bedrooms and Bathrooms
- 4 Bedrooms
- 3 Full Bathrooms
Laundry
- Laundry closet
- Stacked Washer and Dryer
Utilities
- Separate Water Meter
Community Details
- Association fees include common area maintenance, trash pickup, water
- 3 Units
- No Name Community
Listing and Financial Details
- Assessor Parcel Number 423-615-01-01
Ownership History
Date
Name
Owned For
Owner Type
Purchase Details
Closed on
Jun 6, 2024
Sold by
Nash Russell P and Nash Kimberly B
Bought by
Russell And Kimberly Nash Living Trust and Nash
Current Estimated Value
Purchase Details
Listed on
Jan 30, 2021
Closed on
Feb 5, 2021
Sold by
Berger Josephine and Robert And Josephine Berger Tr
Bought by
Nash Russell P and Nash Kimberly B
Seller's Agent
Jen Trafficanda
HomeSmart Realty West
Buyer's Agent
Jen Trafficanda
HomeSmart Realty West
List Price
$2,499,995
Sold Price
$2,445,000
Premium/Discount to List
-$54,995
-2.2%
Home Financials for this Owner
Home Financials are based on the most recent Mortgage that was taken out on this home.
Avg. Annual Appreciation
6.38%
Original Mortgage
$1,467,000
Interest Rate
2.7%
Mortgage Type
New Conventional
Purchase Details
Closed on
Mar 4, 2016
Sold by
Berger Josephine
Bought by
Robert & Josephine Berger Trust
Purchase Details
Listed on
Mar 27, 2013
Closed on
Jul 18, 2013
Sold by
Wadlund Arthur Robert and Wadlund Jananne Joyce
Bought by
Berger Josephine
Seller's Agent
Valerie Zatt
Compass
Buyer's Agent
Cherilyn Jones
Premier Realty Associates
List Price
$2,149,999
Sold Price
$1,800,000
Premium/Discount to List
-$349,999
-16.28%
Home Financials for this Owner
Home Financials are based on the most recent Mortgage that was taken out on this home.
Avg. Annual Appreciation
4.94%
Purchase Details
Closed on
Jun 14, 2011
Sold by
Wadlund Arthur Robert and Wadlund Jananne Joyce
Bought by
Wadlund Arthur Robert and Wadlund Jananne Joyce
Home Financials for this Owner
Home Financials are based on the most recent Mortgage that was taken out on this home.
Original Mortgage
$604,000
Interest Rate
3.69%
Mortgage Type
New Conventional
Purchase Details
Closed on
May 22, 2003
Sold by
Wadlund Arthur Robert and Wadlund Jananne Joyce
Bought by
Wadlund Arthur Robert and Wadlund Jananne Joyce
Home Financials for this Owner
Home Financials are based on the most recent Mortgage that was taken out on this home.
Original Mortgage
$701,250
Interest Rate
5%
Mortgage Type
Purchase Money Mortgage
Purchase Details
Closed on
Jun 3, 2002
Sold by
Mackey Kathryn
Bought by
Solovay Mark L
Home Financials for this Owner
Home Financials are based on the most recent Mortgage that was taken out on this home.
Original Mortgage
$700,000
Interest Rate
6.12%
Mortgage Type
Purchase Money Mortgage
Purchase Details
Closed on
May 8, 2002
Sold by
Solovay Mark L and Solovay Alice R
Bought by
Wadlund Arthur Robert and Wadlund Jananne Joyce
Home Financials for this Owner
Home Financials are based on the most recent Mortgage that was taken out on this home.
Original Mortgage
$700,000
Interest Rate
6.12%
Mortgage Type
Purchase Money Mortgage
Purchase Details
Closed on
Oct 26, 1993
Sold by
Solovay Alice R
Bought by
Solovay Alice R
Similar Homes in the area
Create a Home Valuation Report for This Property
The Home Valuation Report is an in-depth analysis detailing your home's value as well as a comparison with similar homes in the area
Home Values in the Area
Average Home Value in this Area
Purchase History
| Date | Type | Sale Price | Title Company |
|---|---|---|---|
| Deed | -- | None Listed On Document | |
| Grant Deed | $2,445,000 | Stewart Title | |
| Interfamily Deed Transfer | -- | None Available | |
| Grant Deed | $1,800,000 | Title 365 | |
| Interfamily Deed Transfer | -- | Accommodation | |
| Interfamily Deed Transfer | -- | Chicago Title Company | |
| Interfamily Deed Transfer | -- | Lawyers Title Company | |
| Interfamily Deed Transfer | -- | Lawyers Title Company | |
| Interfamily Deed Transfer | -- | Chicago Title Company | |
| Grant Deed | $935,000 | Chicago Title Company | |
| Quit Claim Deed | -- | -- |
Source: Public Records
Mortgage History
| Date | Status | Loan Amount | Loan Type |
|---|---|---|---|
| Previous Owner | $1,467,000 | New Conventional | |
| Previous Owner | $315,000 | Unknown | |
| Previous Owner | $1,100,000 | New Conventional | |
| Previous Owner | $604,000 | New Conventional | |
| Previous Owner | $701,250 | Purchase Money Mortgage | |
| Previous Owner | $700,000 | Purchase Money Mortgage |
Source: Public Records
Property History
| Date | Event | Price | Change | Sq Ft Price |
|---|---|---|---|---|
| 03/09/2021 03/09/21 | Sold | $2,445,000 | -2.2% | $1,358 / Sq Ft |
| 01/30/2021 01/30/21 | For Sale | $2,499,995 | +38.9% | $1,389 / Sq Ft |
| 01/29/2021 01/29/21 | Pending | -- | -- | -- |
| 07/30/2013 07/30/13 | Sold | $1,800,000 | -7.6% | $1,000 / Sq Ft |
| 07/17/2013 07/17/13 | Pending | -- | -- | -- |
| 06/27/2013 06/27/13 | Price Changed | $1,949,000 | -9.3% | $1,083 / Sq Ft |
| 03/27/2013 03/27/13 | For Sale | $2,149,999 | -- | $1,194 / Sq Ft |
Source: San Diego MLS
Tax History Compared to Growth
Tax History
| Year | Tax Paid | Tax Assessment Tax Assessment Total Assessment is a certain percentage of the fair market value that is determined by local assessors to be the total taxable value of land and additions on the property. | Land | Improvement |
|---|---|---|---|---|
| 2025 | $31,907 | $2,646,544 | $2,289,343 | $357,201 |
| 2024 | $31,907 | $2,594,652 | $2,244,454 | $350,198 |
| 2023 | $31,205 | $2,543,778 | $2,200,446 | $343,332 |
| 2022 | $30,375 | $2,493,900 | $2,157,300 | $336,600 |
| 2021 | $25,158 | $2,038,511 | $1,698,761 | $339,750 |
| 2020 | $24,851 | $2,017,610 | $1,681,343 | $336,267 |
| 2019 | $24,408 | $1,978,050 | $1,648,376 | $329,674 |
| 2018 | $22,817 | $1,939,265 | $1,616,055 | $323,210 |
| 2017 | $22,281 | $1,901,241 | $1,584,368 | $316,873 |
| 2016 | $21,930 | $1,863,962 | $1,553,302 | $310,660 |
| 2015 | $21,607 | $1,835,964 | $1,529,970 | $305,994 |
| 2014 | $21,261 | $1,800,000 | $1,500,000 | $300,000 |
Source: Public Records
Agents Affiliated with this Home
-
Jen Trafficanda
Seller's Agent in 2021
Jen Trafficanda
HomeSmart Realty West
(858) 987-2121
1 in this area
13 Total Sales
-
Valerie Zatt
Seller's Agent in 2013
Valerie Zatt
Compass
(858) 882-7932
4 in this area
75 Total Sales
-
C
Buyer's Agent in 2013
Cherilyn Jones
Premier Realty Associates
Map
Source: San Diego MLS
MLS Number: 210002529
APN: 423-615-01-01
Disclaimer: Certain information contained herein is derived from information provided by parties other than Homes.com. All information provided is deemed reliable, but is not guaranteed to be accurate and should be independently verified.
![]() This information is deemed reliable but not guaranteed. You should rely on this information only to decide whether or not to further investigate a particular property.
This information is deemed reliable but not guaranteed. You should rely on this information only to decide whether or not to further investigate a particular property.
BEFORE MAKING ANY OTHER DECISION, YOU SHOULD PERSONALLY INVESTIGATE THE FACTS (e.g. square footage and lot size) with the assistance of an appropriate professional. You may use this information only to identify properties you may be interested in investigating further. All uses except for personal, noncommercial use in accordance with the foregoing purpose are prohibited. Redistribution or copying of this information, any photographs or video tours is strictly
prohibited. This information is derived from the Internet Data Exchange (IDX) service provided by San Diego MLS. Displayed property listings may be held by a brokerage firm other than the broker and/or agent responsible for this display. The information and any photographs and video tours and the compilation from which they are derived is protected by copyright. Compilation © 2025 San Diego MLS.
Nearby Homes
- 801 Nantasket Ct Unit B
- 801 Liverpool Ct Unit 9
- 724 Ormond Ct
- 3391 Ocean Front Walk Unit D
- 3366 Bayside Walk
- 3719 Mission Blvd
- 821 Portsmouth Ct Unit E
- 735 Jersey Ct
- 814-16 Pismo Ct
- 830 Pismo Ct
- 810 Santa Barbara Place
- 728 Jamaica Ct
- 3291 Bayside Walk
- 3286-88 Bayside Walk
- 3756-58 Mission Blvd Unit H,I,J,K,L
- 713 San Jose Place
- 821 Jamaica Ct
- 3255 Ocean Front Walk
- 717 Island Ct
- 715 Toulon Ct