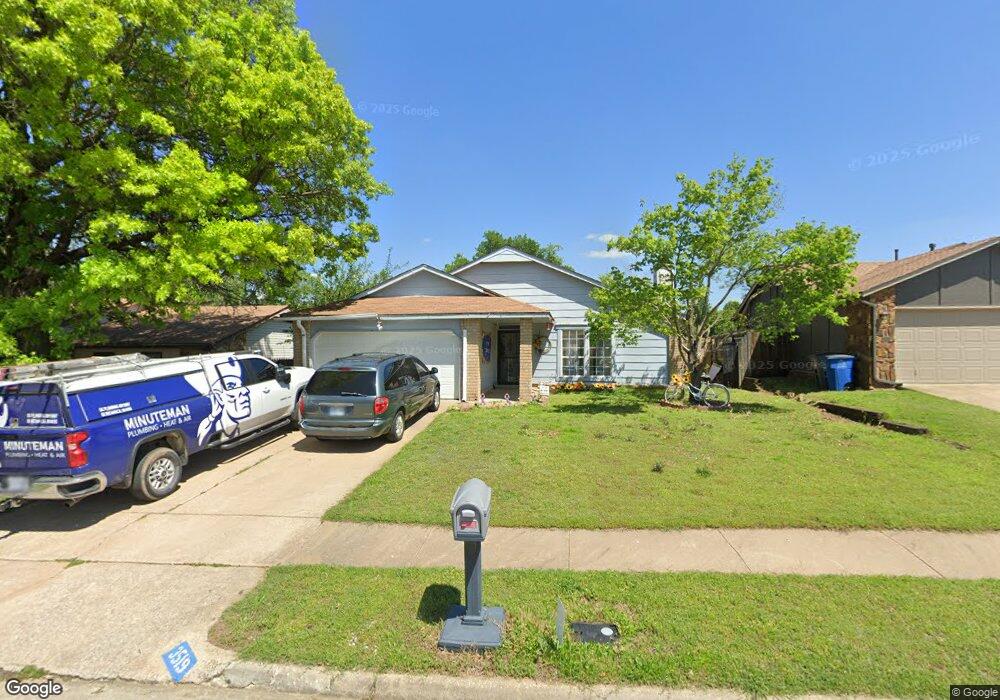
3519 S 151st East Place Tulsa, OK 74134
Park Plaza East NeighborhoodEstimated Value: $186,519 - $197,000
--
Bed
2
Baths
1,212
Sq Ft
$157/Sq Ft
Est. Value
About This Home
This home is located at 3519 S 151st East Place, Tulsa, OK 74134 and is currently estimated at $189,880, approximately $156 per square foot. 3519 S 151st East Place is a home located in Tulsa County with nearby schools including Country Lane Primary Elementary School, Country Lane Intermediate School, and Centennial Middle School.
Ownership History
Date
Name
Owned For
Owner Type
Purchase Details
Closed on
Jun 8, 2006
Sold by
Lavoie Denis and Lavoie Cordula
Bought by
Finley Anthony and Finley Deanne
Current Estimated Value
Home Financials for this Owner
Home Financials are based on the most recent Mortgage that was taken out on this home.
Original Mortgage
$90,000
Outstanding Balance
$52,883
Interest Rate
6.56%
Mortgage Type
Unknown
Estimated Equity
$136,997
Purchase Details
Closed on
May 21, 2004
Sold by
Hendren Joseph L and Hendren Joseph Le
Bought by
Lavoie Denis and Lavoie Cordula
Purchase Details
Closed on
Jan 25, 2001
Sold by
Kelley Patrick N and Kelley Tamarah J
Bought by
Hendren Joseph L and Hendren April
Home Financials for this Owner
Home Financials are based on the most recent Mortgage that was taken out on this home.
Original Mortgage
$58,800
Interest Rate
7.21%
Mortgage Type
Purchase Money Mortgage
Create a Home Valuation Report for This Property
The Home Valuation Report is an in-depth analysis detailing your home's value as well as a comparison with similar homes in the area
Home Values in the Area
Average Home Value in this Area
Purchase History
| Date | Buyer | Sale Price | Title Company |
|---|---|---|---|
| Finley Anthony | $90,000 | First American Title & Abstr | |
| Lavoie Denis | $90,000 | -- | |
| Hendren Joseph L | $73,000 | -- |
Source: Public Records
Mortgage History
| Date | Status | Borrower | Loan Amount |
|---|---|---|---|
| Open | Finley Anthony | $90,000 | |
| Previous Owner | Hendren Joseph L | $58,800 |
Source: Public Records
Tax History Compared to Growth
Tax History
| Year | Tax Paid | Tax Assessment Tax Assessment Total Assessment is a certain percentage of the fair market value that is determined by local assessors to be the total taxable value of land and additions on the property. | Land | Improvement |
|---|---|---|---|---|
| 2024 | $1,619 | $13,350 | $1,940 | $11,410 |
| 2023 | $1,619 | $12,715 | $1,872 | $10,843 |
| 2022 | $1,607 | $12,110 | $2,250 | $9,860 |
| 2021 | $1,546 | $11,533 | $2,143 | $9,390 |
| 2020 | $1,467 | $10,984 | $2,319 | $8,665 |
| 2019 | $1,521 | $10,984 | $2,319 | $8,665 |
| 2018 | $1,502 | $10,984 | $2,319 | $8,665 |
| 2017 | $1,499 | $10,984 | $2,319 | $8,665 |
| 2016 | $1,474 | $10,920 | $2,305 | $8,615 |
| 2015 | $1,407 | $10,401 | $2,196 | $8,205 |
| 2014 | $1,367 | $10,098 | $2,132 | $7,966 |
Source: Public Records
Map
Nearby Homes
- 15018 E 35th St
- 15002 E 35th Place
- 3544 S 150th East Ave
- 3711 S 151st East Ave
- 3720 S 150th East Ave
- 3740 S 150th East Ave
- 3749 S 153rd East Ave
- 4006 S 149th East Ave
- 14618 E 39th St S
- Cleveland Plan at Battle Creek Park - Wellington Collection
- Carter Plan at Battle Creek Park - Wellington Collection
- Buchanon Plan at Battle Creek Park - Wellington Collection
- Bailey Plan at Battle Creek Park - Wellington Collection
- Reagan Plus Plan at Battle Creek Park - Wellington Collection
- Reagan Plan at Battle Creek Park - Wellington Collection
- Raleigh Plan at Battle Creek Park - Wellington Collection
- Opal Plan at Battle Creek Park - Wellington Collection
- Lindsey Plan at Battle Creek Park - Wellington Collection
- Victoria Plan at Battle Creek Park - Sonoma Collection
- Valerie Plan at Battle Creek Park - Sonoma Collection
- 3523 S 151st East Place
- 3515 S 151st East Place
- 3527 S 151st East Place
- 3511 S 151st East Place
- 3518 S 151st East Place
- 3524 S 151st East Place
- 3512 S 151st East Place
- 3505 S 151st East Place
- 3533 S 151st East Place
- 3528 S 151st Place E
- 3504 S 151st East Place
- 3501 S 151st East Place
- 3534 S 151st East Place
- 15041 E 35th Place
- 15036 E 35th Place
- 15115 E 36th St
- 15035 E 35th Place
- 15123 E 35th St
- 15114 E 35th St