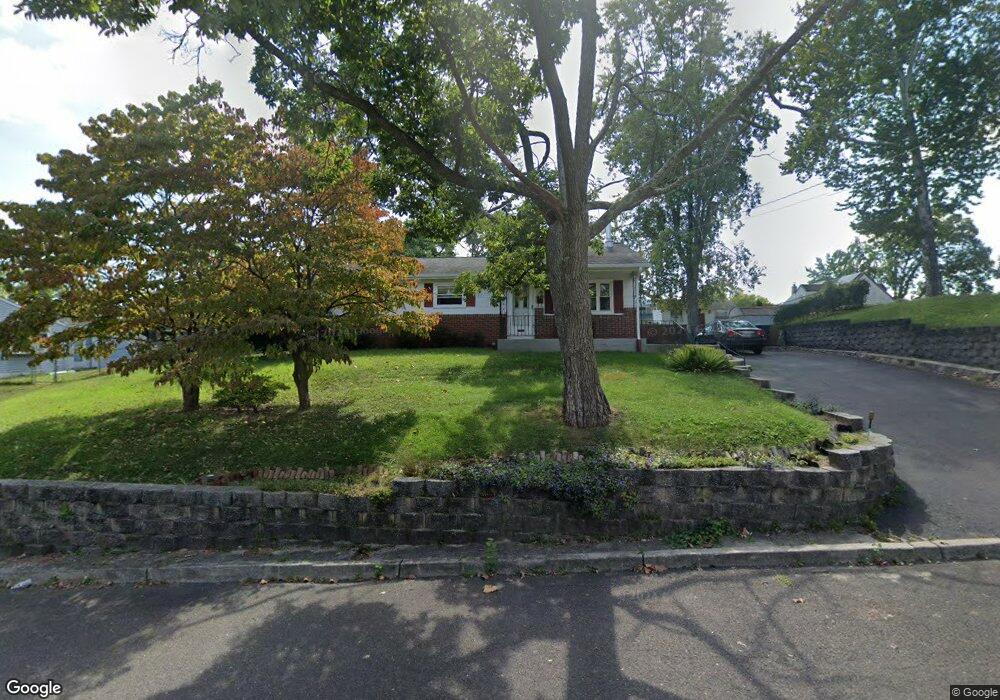
352 5th Ave Lindenwold, NJ 08021
Estimated Value: $271,917 - $310,000
3
Beds
1
Bath
1,286
Sq Ft
$227/Sq Ft
Est. Value
About This Home
This home is located at 352 5th Ave, Lindenwold, NJ 08021 and is currently estimated at $291,729, approximately $226 per square foot. 352 5th Ave is a home located in Camden County with nearby schools including Memorial Middle School, Lindenwold High School, and Saint John Paul II Regional School.
Ownership History
Date
Name
Owned For
Owner Type
Purchase Details
Closed on
Oct 13, 2009
Sold by
Mastalski Justin R and Mastalski Lauren
Bought by
Englehart Theresa M
Current Estimated Value
Home Financials for this Owner
Home Financials are based on the most recent Mortgage that was taken out on this home.
Original Mortgage
$143,250
Outstanding Balance
$93,444
Interest Rate
5.06%
Mortgage Type
Purchase Money Mortgage
Estimated Equity
$198,285
Purchase Details
Closed on
Apr 11, 2003
Sold by
Mastalski Robert J
Bought by
Mastalski Justin R
Home Financials for this Owner
Home Financials are based on the most recent Mortgage that was taken out on this home.
Original Mortgage
$89,600
Interest Rate
5.93%
Create a Home Valuation Report for This Property
The Home Valuation Report is an in-depth analysis detailing your home's value as well as a comparison with similar homes in the area
Home Values in the Area
Average Home Value in this Area
Purchase History
| Date | Buyer | Sale Price | Title Company |
|---|---|---|---|
| Englehart Theresa M | $153,250 | -- | |
| Mastalski Justin R | $112,000 | -- |
Source: Public Records
Mortgage History
| Date | Status | Borrower | Loan Amount |
|---|---|---|---|
| Open | Englehart Theresa M | $143,250 | |
| Previous Owner | Mastalski Justin R | $89,600 |
Source: Public Records
Tax History Compared to Growth
Tax History
| Year | Tax Paid | Tax Assessment Tax Assessment Total Assessment is a certain percentage of the fair market value that is determined by local assessors to be the total taxable value of land and additions on the property. | Land | Improvement |
|---|---|---|---|---|
| 2025 | $5,766 | $116,600 | $40,000 | $76,600 |
| 2024 | $5,797 | $116,600 | $40,000 | $76,600 |
| 2023 | $5,797 | $116,600 | $40,000 | $76,600 |
| 2022 | $5,792 | $116,600 | $40,000 | $76,600 |
| 2021 | $5,649 | $116,600 | $40,000 | $76,600 |
| 2020 | $5,916 | $116,600 | $40,000 | $76,600 |
| 2019 | $5,969 | $116,600 | $40,000 | $76,600 |
| 2018 | $5,954 | $116,600 | $40,000 | $76,600 |
| 2017 | $5,775 | $116,600 | $40,000 | $76,600 |
| 2016 | $5,646 | $116,600 | $40,000 | $76,600 |
| 2015 | $5,408 | $116,600 | $40,000 | $76,600 |
| 2014 | $5,172 | $116,600 | $40,000 | $76,600 |
Source: Public Records
Map
Nearby Homes
- 323 3rd Ave
- 335 2nd Ave
- 409 9th Ave
- 441 8th Ave
- 413 10th Ave
- 225 Chews Landing Rd
- 334 Chews Landing Rd
- 531 6th Ave
- 524 8th Ave
- 118 1st Ave
- 605 4th Ave
- 609 8th Ave
- 37 Chiswick Dr
- 2004 Greenwood Dr
- 1802 Greenwood Dr
- 2005 Greenwood Dr
- 1908 Greenwood Dr Unit C1908
- 514 Park Ave
- 2702 Greenwood Dr
- 42 Trowbridge Ln Unit DD