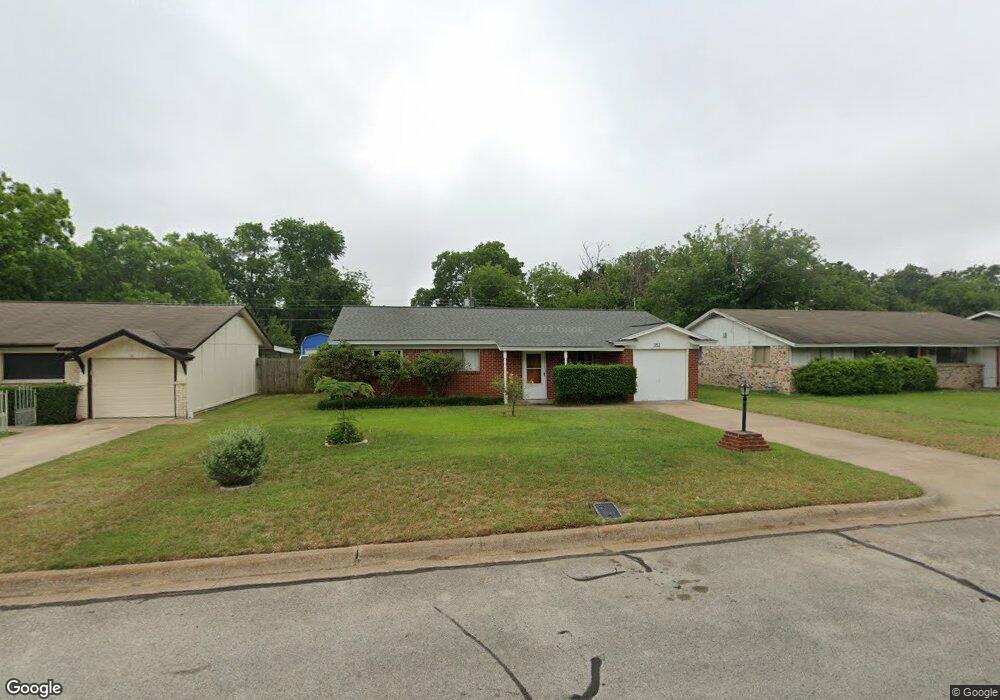
352 Belle St Bedford, TX 76022
Estimated Value: $254,864 - $304,000
3
Beds
2
Baths
1,137
Sq Ft
$239/Sq Ft
Est. Value
About This Home
This home is located at 352 Belle St, Bedford, TX 76022 and is currently estimated at $272,216, approximately $239 per square foot. 352 Belle St is a home located in Tarrant County with nearby schools including Stonegate Elementary School, Central J High School, and L.D. Bell High School.
Ownership History
Date
Name
Owned For
Owner Type
Purchase Details
Closed on
Feb 25, 2020
Sold by
Wilson Ronald Joe and Wilson Gary Gene
Bought by
Cauthen Paul A and Cauthen Donica G
Current Estimated Value
Home Financials for this Owner
Home Financials are based on the most recent Mortgage that was taken out on this home.
Original Mortgage
$181,649
Outstanding Balance
$164,101
Interest Rate
4.62%
Mortgage Type
FHA
Estimated Equity
$108,115
Purchase Details
Closed on
Apr 29, 2014
Sold by
Wilson Dorothy Edith
Bought by
Wilson Dorothy and Wilson Ronald Joe
Create a Home Valuation Report for This Property
The Home Valuation Report is an in-depth analysis detailing your home's value as well as a comparison with similar homes in the area
Home Values in the Area
Average Home Value in this Area
Purchase History
| Date | Buyer | Sale Price | Title Company |
|---|---|---|---|
| Cauthen Paul A | -- | Independence Title | |
| Wilson Dorothy | -- | None Available |
Source: Public Records
Mortgage History
| Date | Status | Borrower | Loan Amount |
|---|---|---|---|
| Open | Cauthen Paul A | $181,649 |
Source: Public Records
Tax History Compared to Growth
Tax History
| Year | Tax Paid | Tax Assessment Tax Assessment Total Assessment is a certain percentage of the fair market value that is determined by local assessors to be the total taxable value of land and additions on the property. | Land | Improvement |
|---|---|---|---|---|
| 2025 | $3,509 | $245,000 | $55,000 | $190,000 |
| 2024 | $3,509 | $303,148 | $55,000 | $248,148 |
| 2023 | $4,220 | $259,255 | $35,000 | $224,255 |
| 2022 | $4,368 | $200,000 | $35,000 | $165,000 |
| 2021 | $4,388 | $186,262 | $35,000 | $151,262 |
| 2020 | $3,507 | $147,518 | $35,000 | $112,518 |
| 2019 | $3,215 | $132,342 | $35,000 | $97,342 |
| 2018 | $2,801 | $115,289 | $10,000 | $105,289 |
| 2017 | $2,595 | $107,272 | $10,000 | $97,272 |
| 2016 | $2,369 | $97,910 | $10,000 | $87,910 |
| 2015 | $1,557 | $62,000 | $8,500 | $53,500 |
| 2014 | $1,557 | $62,000 | $8,500 | $53,500 |
Source: Public Records
Map
Nearby Homes
- 344 Bedford Ct E
- 1008 Russell Ln
- 341 Hurst Dr
- 501 Merrill Dr
- 1236 King Dr
- 905 Brown Trail
- 849 Russell Ln
- 1108 Wade Dr
- 933 Wade Dr
- 49 Coffee Tavern Rd
- 604 Donna Ln
- 803 Glenda Dr
- 802 Brown Trail
- 1220 Norwood Dr
- 1136 Simpson Dr
- 116 Oakhurst Dr
- 832 Chateau Valee Cir
- 1348 Norwood Dr
- 140 Stonegate Ct
- 93 Regents Park