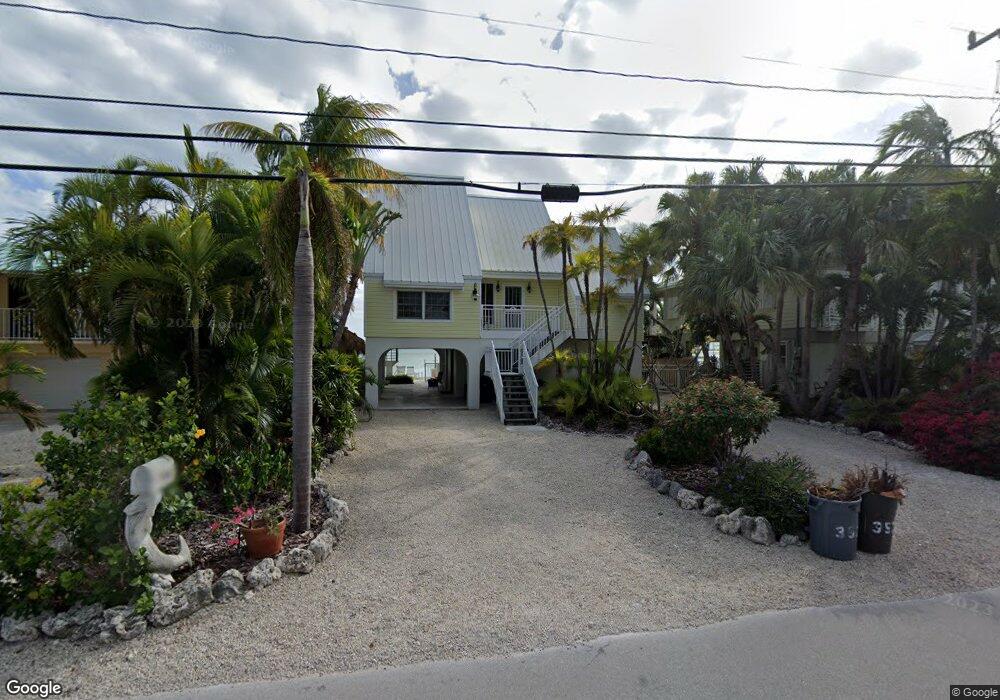
352 Caribbean Dr E Summerland Key, FL 33042
Estimated Value: $1,771,718 - $1,954,000
4
Beds
3
Baths
2,080
Sq Ft
$891/Sq Ft
Est. Value
About This Home
This home is located at 352 Caribbean Dr E, Summerland Key, FL 33042 and is currently estimated at $1,854,180, approximately $891 per square foot. 352 Caribbean Dr E is a home located in Monroe County with nearby schools including Sugarloaf School and Key West High School.
Ownership History
Date
Name
Owned For
Owner Type
Purchase Details
Closed on
Nov 30, 2015
Sold by
Proctor Folsom C and Proctor Karen W
Bought by
Proctor Folsom C
Current Estimated Value
Purchase Details
Closed on
Mar 11, 1999
Bought by
Proctor Folsom C
Purchase Details
Closed on
Sep 25, 1995
Sold by
Wiita Richard and Wiita Phyllis
Bought by
Pumphrey David W and Pumphrey Christine A
Home Financials for this Owner
Home Financials are based on the most recent Mortgage that was taken out on this home.
Original Mortgage
$276,300
Interest Rate
7.93%
Purchase Details
Closed on
Sep 1, 1995
Bought by
Proctor Folsom C
Home Financials for this Owner
Home Financials are based on the most recent Mortgage that was taken out on this home.
Original Mortgage
$276,300
Interest Rate
7.93%
Purchase Details
Closed on
Mar 1, 1983
Bought by
Proctor Folsom C
Purchase Details
Closed on
Feb 1, 1979
Bought by
Proctor Folsom C
Create a Home Valuation Report for This Property
The Home Valuation Report is an in-depth analysis detailing your home's value as well as a comparison with similar homes in the area
Home Values in the Area
Average Home Value in this Area
Purchase History
| Date | Buyer | Sale Price | Title Company |
|---|---|---|---|
| Proctor Folsom C | -- | Attorney | |
| Proctor Folsom C | $460,000 | -- | |
| Pumphrey David W | $307,000 | -- | |
| Proctor Folsom C | $307,000 | -- | |
| Proctor Folsom C | $125,000 | -- | |
| Proctor Folsom C | $160,000 | -- |
Source: Public Records
Mortgage History
| Date | Status | Borrower | Loan Amount |
|---|---|---|---|
| Previous Owner | Pumphrey David W | $276,300 |
Source: Public Records
Tax History Compared to Growth
Tax History
| Year | Tax Paid | Tax Assessment Tax Assessment Total Assessment is a certain percentage of the fair market value that is determined by local assessors to be the total taxable value of land and additions on the property. | Land | Improvement |
|---|---|---|---|---|
| 2024 | $11,694 | $1,710,539 | $1,230,000 | $480,539 |
| 2023 | $11,694 | $1,762,518 | $1,303,500 | $459,018 |
| 2022 | $9,441 | $1,168,309 | $702,000 | $466,309 |
| 2021 | $8,779 | $928,784 | $537,000 | $391,784 |
| 2020 | $8,039 | $827,926 | $523,500 | $304,426 |
| 2019 | $9,277 | $958,298 | $649,500 | $308,798 |
| 2018 | $9,323 | $986,551 | $684,000 | $302,551 |
| 2017 | $8,201 | $825,811 | $0 | $0 |
| 2016 | $8,257 | $813,620 | $0 | $0 |
| 2015 | $7,784 | $730,276 | $0 | $0 |
| 2014 | $10,388 | $961,003 | $0 | $0 |
Source: Public Records
Map
Nearby Homes
- 24285 Caribbean Dr
- 24356 Overseas Hwy
- 24931 Overseas Hwy
- 680 Cruikshank Island
- 835 Gulf Dr
- 860 Lagoon Dr
- 876 Gulf Dr
- 466 W Shore Dr
- 951 Lagoon Dr
- 937 Gulf Dr
- 948 Gulf Dr
- 974 Flagship Dr
- 554 W Shore Dr
- 231 E Shore Dr Unit 7
- 231 E Shore Dr Unit 6
- 231 E Shore Dr Unit 4
- 231 E Shore Dr Unit 2
- 231 E Shore Dr Unit 5
- 231 E Shore Dr Unit 1
- 231 E Shore Dr Unit 3
- 342 Caribbean Dr E
- 362 Caribbean Dr E
- 332 Caribbean Dr E
- 372 Caribbean Dr E
- 351 Caribbean Dr E
- 361 Caribbean Dr E
- 341 Caribbean Dr E
- 382 Caribbean Dr E
- 322 Caribbean Dr E
- 371 Caribbean Dr E
- 331 Caribbean Dr E
- 381 Caribbean Dr E
- 321 Caribbean Dr E
- 312 Caribbean Dr E
- 414 Caribbean Dr E
- 413 Caribbean Dr E
- 311 Caribbean Dr E
- 424 Caribbean Dr E
- 296 Caribbean Dr E
- 250 Airport Dr S