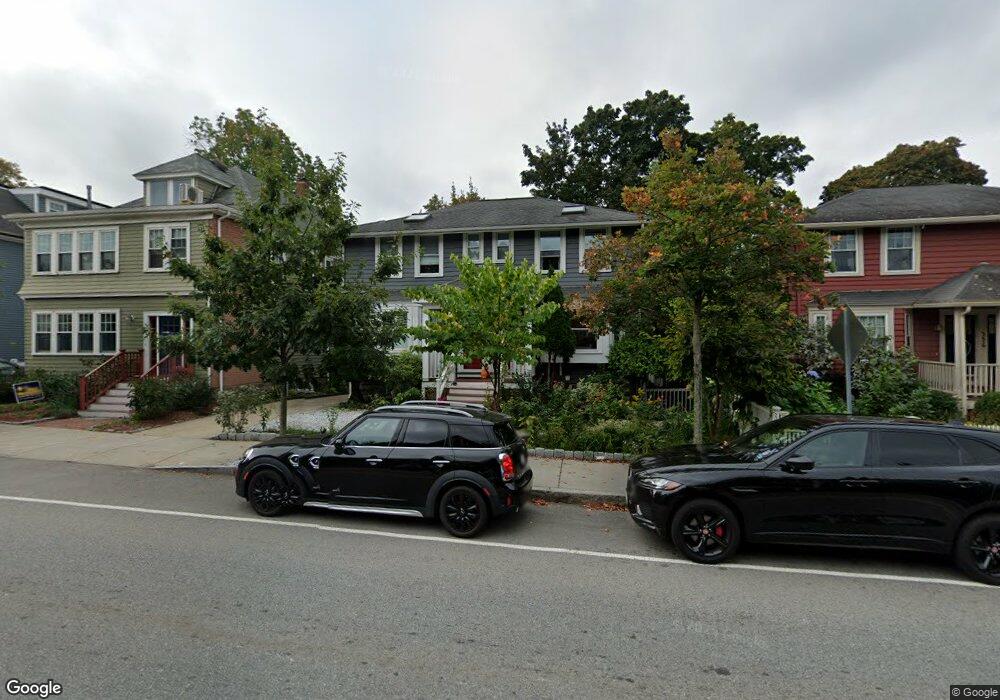
352 Concord Ave Cambridge, MA 02138
West Cambridge NeighborhoodEstimated Value: $929,000 - $1,210,000
2
Beds
2
Baths
1,052
Sq Ft
$1,024/Sq Ft
Est. Value
About This Home
This home is located at 352 Concord Ave, Cambridge, MA 02138 and is currently estimated at $1,077,264, approximately $1,024 per square foot. 352 Concord Ave is a home located in Middlesex County with nearby schools including Benjamin Banneker Charter Public School, Cambridge Montessori School, and St Peter School.
Ownership History
Date
Name
Owned For
Owner Type
Purchase Details
Closed on
Apr 25, 2017
Sold by
Damsky Benjamin P and Damsky Lauren E
Bought by
Afshar Pouya and Moridpour Neda
Current Estimated Value
Home Financials for this Owner
Home Financials are based on the most recent Mortgage that was taken out on this home.
Original Mortgage
$602,000
Outstanding Balance
$485,804
Interest Rate
3.5%
Mortgage Type
New Conventional
Estimated Equity
$591,460
Purchase Details
Closed on
Jun 29, 2007
Sold by
American Intl Reloc So
Bought by
Olean Adam R and Dymacek Jennie B
Home Financials for this Owner
Home Financials are based on the most recent Mortgage that was taken out on this home.
Original Mortgage
$169,000
Interest Rate
6.24%
Mortgage Type
Purchase Money Mortgage
Purchase Details
Closed on
May 24, 2002
Sold by
Est Barbour Alice M and Dorsey Elizabeth L
Bought by
Toomey Daniel P
Create a Home Valuation Report for This Property
The Home Valuation Report is an in-depth analysis detailing your home's value as well as a comparison with similar homes in the area
Home Values in the Area
Average Home Value in this Area
Purchase History
| Date | Buyer | Sale Price | Title Company |
|---|---|---|---|
| Afshar Pouya | $792,000 | -- | |
| Afshar Pouya | $792,000 | -- | |
| Olean Adam R | $470,000 | -- | |
| American Intl Reloc So | $470,000 | -- | |
| American Intl Reloc So | $470,000 | -- | |
| Olean Adam R | $470,000 | -- | |
| American Intl Reloc So | $470,000 | -- | |
| Toomey Daniel P | $522,000 | -- |
Source: Public Records
Mortgage History
| Date | Status | Borrower | Loan Amount |
|---|---|---|---|
| Open | Afshar Pouya | $602,000 | |
| Closed | Afshar Pouya | $602,000 | |
| Previous Owner | American Intl Reloc So | $74,250 | |
| Previous Owner | American Intl Reloc So | $388,645 | |
| Previous Owner | American Intl Reloc So | $169,000 |
Source: Public Records
Tax History
| Year | Tax Paid | Tax Assessment Tax Assessment Total Assessment is a certain percentage of the fair market value that is determined by local assessors to be the total taxable value of land and additions on the property. | Land | Improvement |
|---|---|---|---|---|
| 2025 | $6,885 | $1,084,200 | $0 | $1,084,200 |
| 2024 | $6,231 | $1,052,500 | $0 | $1,052,500 |
| 2023 | $5,971 | $1,018,900 | $0 | $1,018,900 |
| 2022 | $5,815 | $982,200 | $0 | $982,200 |
| 2021 | $5,459 | $933,200 | $0 | $933,200 |
| 2020 | $5,203 | $904,900 | $0 | $904,900 |
| 2019 | $5,003 | $842,200 | $0 | $842,200 |
| 2018 | $4,754 | $755,800 | $0 | $755,800 |
| 2017 | $4,633 | $713,900 | $0 | $713,900 |
| 2016 | $4,532 | $648,400 | $0 | $648,400 |
| 2015 | $4,503 | $575,800 | $0 | $575,800 |
| 2014 | $4,462 | $532,400 | $0 | $532,400 |
Source: Public Records
Map
Nearby Homes
- 14-16 Field St
- 32 Copley St Unit 2
- 318 Concord Ave Unit 1
- 318 Concord Ave Unit 2
- 204 Garden St
- 281 Concord Ave
- 59-61 Reservoir St Unit 2
- 140 Huron Ave
- 382 Huron Ave
- 12 Gray Gardens W Unit 14
- 61 Bolton St Unit 304
- 151 Sherman St
- 151 Sherman St Unit 151
- 84 Garden St
- 178 Richdale Ave
- 117 Lexington Ave Unit 117
- 153 Brattle St
- 180 Larch Rd
- 29 Wheeler St Unit 108
- 29 Wheeler St Unit 310
- 350 Concord Ave
- 350 Concord Ave Unit 2 350 Concord Ave.
- 350 Concord Ave
- 350 Concord Ave Unit 2
- 352 Concord Ave Unit 352
- 348 Concord Ave Unit Ave
- 356 Concord Ave
- 346 Concord Ave Unit 348
- 346 Concord Ave Unit 348
- 346 Concord Ave Unit 1
- 346 Concord Ave Unit 2
- 346 Concord Ave
- 344 Concord Ave Unit 344
- 120 Chilton St
- 342 Concord Ave
- 353 Concord Ave
- 353 Concord Ave Unit 2
- 141 Fayerweather St Unit 2
- 141 Fayerweather St Unit 1
- 355 Concord Ave Unit B
Your Personal Tour Guide
Ask me questions while you tour the home.