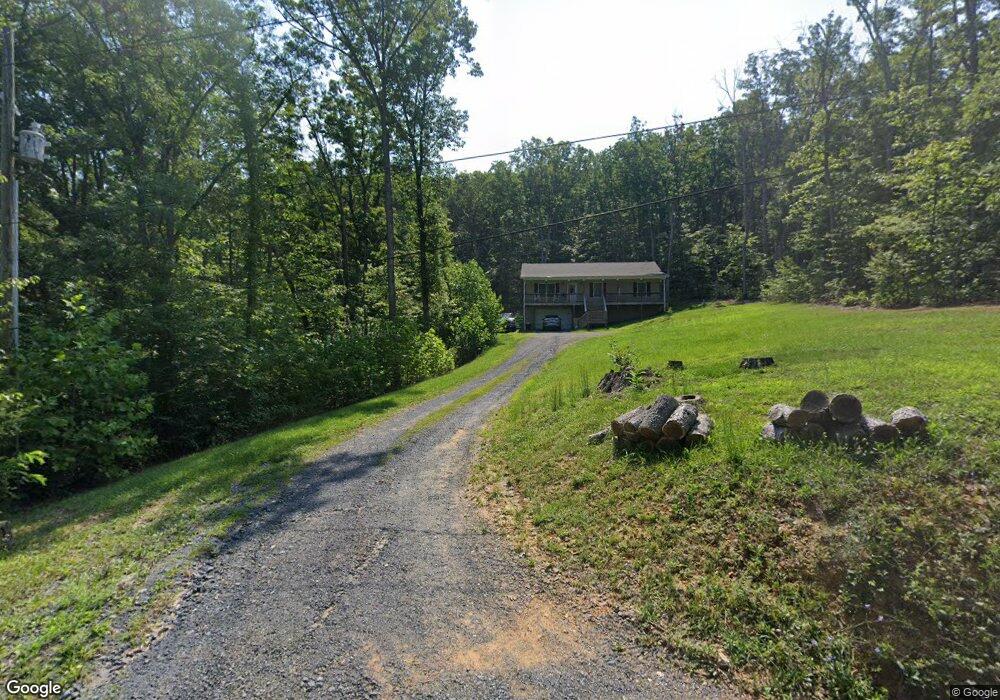
352 Dry Run Ct Front Royal, VA 22630
Estimated Value: $391,683 - $435,000
3
Beds
2
Baths
1,300
Sq Ft
$311/Sq Ft
Est. Value
About This Home
This home is located at 352 Dry Run Ct, Front Royal, VA 22630 and is currently estimated at $404,921, approximately $311 per square foot. 352 Dry Run Ct is a home located in Warren County with nearby schools including Leslie Fox Keyser Elementary School and Warren County High School.
Ownership History
Date
Name
Owned For
Owner Type
Purchase Details
Closed on
Oct 29, 2019
Sold by
Church Aaron Finley and Alger Gabrielle Gianna
Bought by
Church Aaron Finley
Current Estimated Value
Home Financials for this Owner
Home Financials are based on the most recent Mortgage that was taken out on this home.
Original Mortgage
$259,450
Outstanding Balance
$228,340
Interest Rate
3.62%
Mortgage Type
FHA
Estimated Equity
$176,581
Purchase Details
Closed on
May 25, 2018
Sold by
Mac Properties Llc
Bought by
Church Aaron Finley and Alger Gabrielle Gianna
Home Financials for this Owner
Home Financials are based on the most recent Mortgage that was taken out on this home.
Original Mortgage
$254,003
Interest Rate
4.62%
Mortgage Type
FHA
Purchase Details
Closed on
Jan 5, 2011
Sold by
Mac Properties Llc
Bought by
Wu Allen L and Chan Chor Yum
Purchase Details
Closed on
Sep 24, 2008
Sold by
Shi Yelin
Bought by
Mac Properties Llc
Create a Home Valuation Report for This Property
The Home Valuation Report is an in-depth analysis detailing your home's value as well as a comparison with similar homes in the area
Home Values in the Area
Average Home Value in this Area
Purchase History
| Date | Buyer | Sale Price | Title Company |
|---|---|---|---|
| Church Aaron Finley | -- | Security Title Ins Agcy Inc | |
| Church Aaron Finley | $258,690 | Saratoga Title & Escrow Inc | |
| Wu Allen L | -- | -- | |
| Mac Properties Llc | -- | -- |
Source: Public Records
Mortgage History
| Date | Status | Borrower | Loan Amount |
|---|---|---|---|
| Open | Church Aaron Finley | $259,450 | |
| Closed | Church Aaron Finley | $254,003 |
Source: Public Records
Tax History Compared to Growth
Tax History
| Year | Tax Paid | Tax Assessment Tax Assessment Total Assessment is a certain percentage of the fair market value that is determined by local assessors to be the total taxable value of land and additions on the property. | Land | Improvement |
|---|---|---|---|---|
| 2025 | $2,048 | $427,500 | $51,400 | $376,100 |
| 2024 | $1,874 | $353,500 | $57,500 | $296,000 |
| 2023 | $1,732 | $353,500 | $57,500 | $296,000 |
| 2022 | $1,548 | $236,300 | $50,000 | $186,300 |
| 2021 | $1,898 | $236,300 | $50,000 | $186,300 |
| 2020 | $1,548 | $236,300 | $50,000 | $186,300 |
| 2019 | $1,548 | $236,300 | $50,000 | $186,300 |
| 2018 | $99 | $15,000 | $15,000 | $0 |
| 2017 | $98 | $15,000 | $15,000 | $0 |
| 2016 | $333 | $15,000 | $15,000 | $0 |
| 2015 | -- | $15,000 | $15,000 | $0 |
| 2014 | -- | $20,000 | $20,000 | $0 |
Source: Public Records
Map
Nearby Homes
- 3515 Howellsville Rd
- 458 Hobbs Knob Rd
- 112 Walker Farm Dr
- 560 Youngs Dr
- 0 Cindy's Way Unit (LOT 20)
- 11 Marino Ln
- 67 Reynolds Ct
- 4792 Howellsville Rd
- 1152 Blue Mountain Rd
- 545 Goode Dr
- 44 Markham Place
- 31 Old Oak Ln
- 358 Wells Dr
- 0 Drummer Hill Rd Unit VAWR2012458
- 0 Drummer Hill Rd Unit LotWP001 23302419
- 0 Drummer Hill Rd Unit VAWR2010946
- 298 Honey Farm Ln
- 671 Pine Ridge Dr
- 0 Timberline Ridge Rd Unit VAWR2012716
- 59 Old Oregon Rd
- 352 Dry Run Ct
- 370 Dry Run Rd
- 298 Dry Run Ct
- 394 Dry Run Ct
- 280 Dry Run Ct
- 333 Dry Run Ct
- 266 Dry Run Ct
- 0 Dry Run Ct Unit 1006944590
- 0 Dry Run Ct Unit WR7899170
- 0 Dry Run Ct Unit VAWR2005978
- 0 Dry Run Ct Unit VAWR2005938
- 0 Dry Run Ct Unit VAWR141506
- 209 Dry Run Ct
- 242 Dry Run Ct
- 236 Dry Run Ct
- 703 Kildare Dr
- 393 Dry Run Ct
- 218 Dry Run Ct
- 84 Silver Fox Ln
- 240 Dry Run Ct