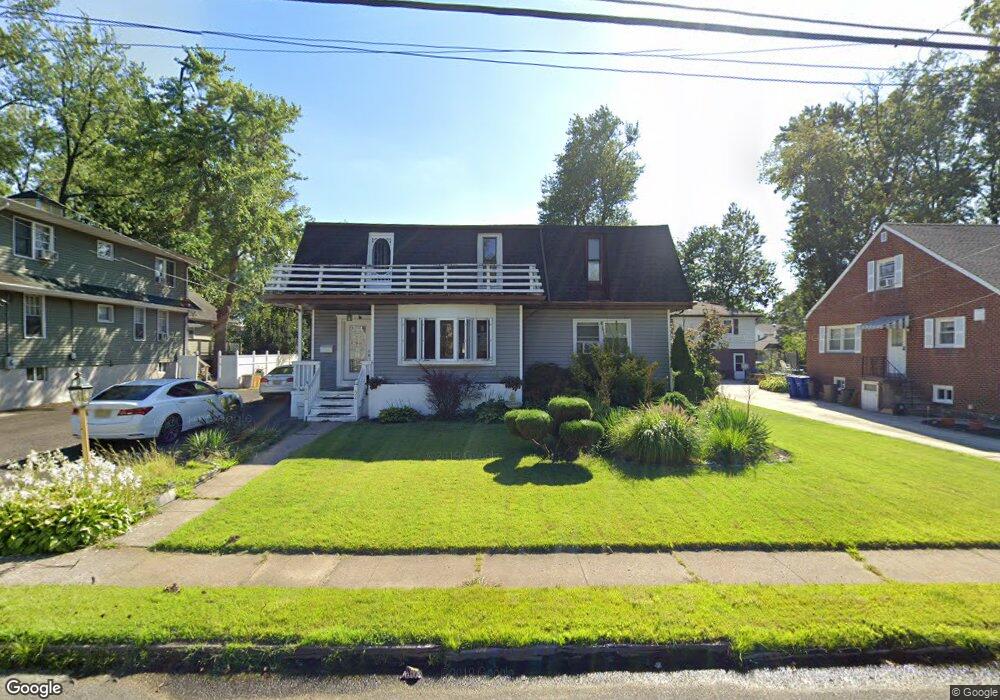
352 Elm Ave Maple Shade, NJ 08052
Estimated Value: $400,000 - $523,000
Studio
--
Bath
2,444
Sq Ft
$180/Sq Ft
Est. Value
About This Home
This home is located at 352 Elm Ave, Maple Shade, NJ 08052 and is currently estimated at $439,231, approximately $179 per square foot. 352 Elm Ave is a home located in Burlington County with nearby schools including Maude M. Wilkins Elementary School, Ralph J Steinhauer Elementary School, and Howard R Yocum School.
Ownership History
Date
Name
Owned For
Owner Type
Purchase Details
Closed on
Feb 10, 2020
Sold by
Norman Valerie A and Johnson Eric W
Bought by
Norman Valerie A and Johnson Valerie A
Current Estimated Value
Purchase Details
Closed on
Aug 27, 2004
Sold by
Parker Linda R and Parker Cheri L
Bought by
Johnson Eric and Johnson Valerie A
Home Financials for this Owner
Home Financials are based on the most recent Mortgage that was taken out on this home.
Original Mortgage
$227,900
Interest Rate
5.84%
Mortgage Type
Purchase Money Mortgage
Purchase Details
Closed on
Aug 30, 1999
Sold by
Love Joseph W and Love Florence A
Bought by
Parker Cheri and Parker Linda
Home Financials for this Owner
Home Financials are based on the most recent Mortgage that was taken out on this home.
Original Mortgage
$143,865
Interest Rate
7.65%
Mortgage Type
FHA
Create a Home Valuation Report for This Property
The Home Valuation Report is an in-depth analysis detailing your home's value as well as a comparison with similar homes in the area
Home Values in the Area
Average Home Value in this Area
Purchase History
| Date | Buyer | Sale Price | Title Company |
|---|---|---|---|
| Norman Valerie A | -- | None Available | |
| Johnson Eric | $239,900 | Weichert Title Agency | |
| Parker Cheri | $145,000 | -- |
Source: Public Records
Mortgage History
| Date | Status | Borrower | Loan Amount |
|---|---|---|---|
| Previous Owner | Johnson Eric | $227,900 | |
| Previous Owner | Parker Cheri | $143,865 |
Source: Public Records
Tax History
| Year | Tax Paid | Tax Assessment Tax Assessment Total Assessment is a certain percentage of the fair market value that is determined by local assessors to be the total taxable value of land and additions on the property. | Land | Improvement |
|---|---|---|---|---|
| 2025 | $7,338 | $193,300 | $50,900 | $142,400 |
| 2024 | $7,125 | $193,300 | $50,900 | $142,400 |
| 2023 | $7,125 | $193,300 | $50,900 | $142,400 |
| 2022 | $7,015 | $193,300 | $50,900 | $142,400 |
| 2021 | $6,947 | $193,300 | $50,900 | $142,400 |
| 2020 | $6,967 | $193,300 | $50,900 | $142,400 |
| 2019 | $6,711 | $193,300 | $50,900 | $142,400 |
| 2018 | $6,595 | $193,300 | $50,900 | $142,400 |
| 2017 | $6,518 | $193,300 | $50,900 | $142,400 |
| 2016 | $6,421 | $193,300 | $50,900 | $142,400 |
| 2015 | $6,282 | $193,300 | $50,900 | $142,400 |
| 2014 | $6,091 | $193,300 | $50,900 | $142,400 |
Source: Public Records
Map
Nearby Homes
- 452 Elm Ave
- 66 W Center Ave
- 44 S Pine Ave
- 15 S Pine Ave
- 47 S Lippincott Ave
- 57 S Terrace Ave
- 22 Theodore Ave
- 26 Morris Ave
- 207 E Park Ave
- 411 A3 Stiles Ave Unit A-3
- 411 C12 Stiles Ave Unit C-12
- 411 A2 Stiles Ave Unit A-2
- 3005 Garfield Ave
- 169 Cherry Tree Ln
- 12 Overbrook Ave
- 115 E Kings Hwy Unit 187
- 115 E Kings Hwy Unit 125
- 2 Wyndale Ave
- 9 Woodbine Ave
- 3001 Church Rd
Your Personal Tour Guide
Ask me questions while you tour the home.