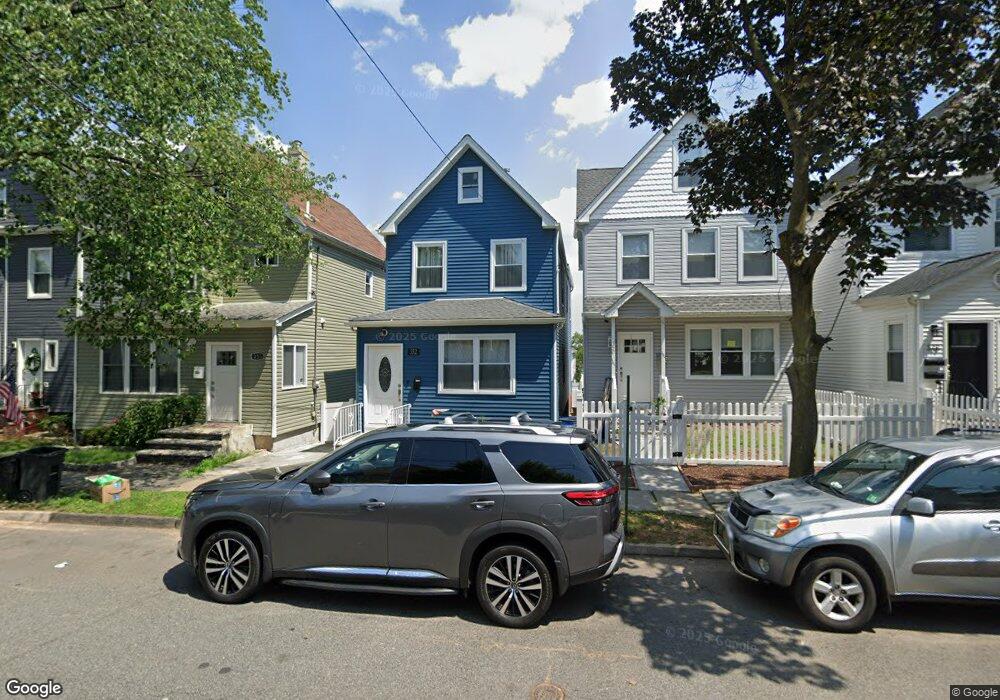
352 Elm St Kearny, NJ 07032
Arlington NeighborhoodEstimated Value: $407,000 - $534,000
Studio
--
Bath
1,463
Sq Ft
$324/Sq Ft
Est. Value
About This Home
This home is located at 352 Elm St, Kearny, NJ 07032 and is currently estimated at $474,000, approximately $323 per square foot. 352 Elm St is a home located in Hudson County with nearby schools including Kearny High School, Hudson Arts and Sciences Charter School, and Kearny Christian Academy.
Ownership History
Date
Name
Owned For
Owner Type
Purchase Details
Closed on
Nov 30, 2005
Sold by
Vertorano Dominick D and Vertorano Helena B
Bought by
Orlondo Percy A and Carbajal Zolla
Current Estimated Value
Home Financials for this Owner
Home Financials are based on the most recent Mortgage that was taken out on this home.
Original Mortgage
$45,887
Outstanding Balance
$25,750
Interest Rate
6.34%
Mortgage Type
Stand Alone Second
Estimated Equity
$448,250
Create a Home Valuation Report for This Property
The Home Valuation Report is an in-depth analysis detailing your home's value as well as a comparison with similar homes in the area
Home Values in the Area
Average Home Value in this Area
Purchase History
| Date | Buyer | Sale Price | Title Company |
|---|---|---|---|
| Orlondo Percy A | $305,910 | First American Title Ins Co |
Source: Public Records
Mortgage History
| Date | Status | Borrower | Loan Amount |
|---|---|---|---|
| Open | Orlondo Percy A | $45,887 | |
| Open | Orlondo Percy A | $244,728 |
Source: Public Records
Tax History
| Year | Tax Paid | Tax Assessment Tax Assessment Total Assessment is a certain percentage of the fair market value that is determined by local assessors to be the total taxable value of land and additions on the property. | Land | Improvement |
|---|---|---|---|---|
| 2025 | $7,836 | $73,200 | $17,500 | $70,700 |
| 2024 | $2,388 | $73,200 | $17,500 | $70,700 |
| 2023 | $2,388 | $22,600 | $17,500 | $5,100 |
| 2022 | $2,382 | $22,600 | $17,500 | $5,100 |
| 2021 | $7,214 | $68,800 | $17,500 | $51,300 |
| 2020 | $7,217 | $68,800 | $17,500 | $51,300 |
| 2019 | $7,253 | $68,800 | $17,500 | $51,300 |
| 2018 | $7,266 | $68,800 | $17,500 | $51,300 |
| 2017 | $7,365 | $68,800 | $17,500 | $51,300 |
| 2016 | $7,340 | $68,800 | $17,500 | $51,300 |
| 2015 | $7,104 | $68,800 | $17,500 | $51,300 |
| 2014 | $6,905 | $68,800 | $17,500 | $51,300 |
Source: Public Records
Map
Nearby Homes
- 390 Forest St
- 425 Davis Ave
- 422 Davis Ave
- 438 Forest St
- 447 Elm St
- 77 Pavonia Ave
- 161 Midland Ave
- 520 Schuyler Ave
- 242 Midland Ave
- 53 Oakwood Ave
- 474 Forest St Unit 11
- 42 Pavonia Ave
- 516 Forest St
- 18 Rutland Ave
- 229 Brighton Ave
- 17 Franklin Place
- 632 Belgrove Dr
- 547 Elm St
- 670 Devon St
- 307 Kearny Ave
Your Personal Tour Guide
Ask me questions while you tour the home.