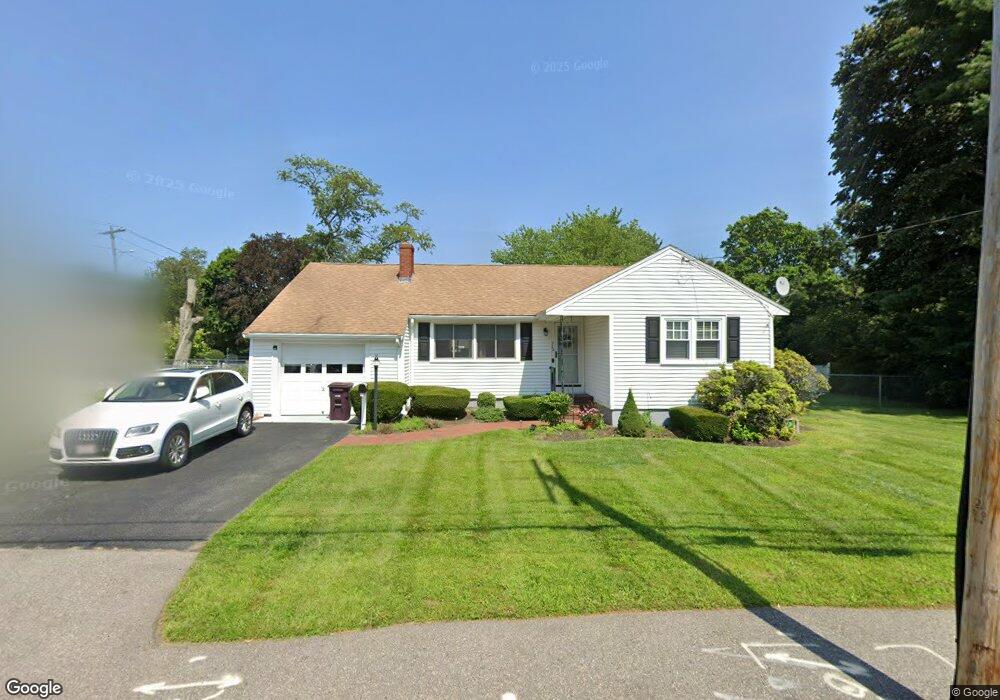
352 Front St Weymouth, MA 02188
Weymouth Landing NeighborhoodEstimated Value: $548,000 - $631,000
3
Beds
1
Bath
1,140
Sq Ft
$517/Sq Ft
Est. Value
About This Home
This home is located at 352 Front St, Weymouth, MA 02188 and is currently estimated at $589,501, approximately $517 per square foot. 352 Front St is a home located in Norfolk County with nearby schools including Frederick C Murphy, Abigail Adams Middle School, and Weymouth Middle School Chapman.
Ownership History
Date
Name
Owned For
Owner Type
Purchase Details
Closed on
Jun 22, 2018
Sold by
Barry John S
Bought by
Kelley Kristen
Current Estimated Value
Home Financials for this Owner
Home Financials are based on the most recent Mortgage that was taken out on this home.
Original Mortgage
$375,250
Outstanding Balance
$324,528
Interest Rate
4.5%
Mortgage Type
New Conventional
Estimated Equity
$264,973
Purchase Details
Closed on
Mar 27, 2018
Sold by
Nally Ruth A Est
Bought by
Barry John S
Create a Home Valuation Report for This Property
The Home Valuation Report is an in-depth analysis detailing your home's value as well as a comparison with similar homes in the area
Home Values in the Area
Average Home Value in this Area
Purchase History
| Date | Buyer | Sale Price | Title Company |
|---|---|---|---|
| Kelley Kristen | $395,000 | -- | |
| Barry John S | $300,000 | -- |
Source: Public Records
Mortgage History
| Date | Status | Borrower | Loan Amount |
|---|---|---|---|
| Open | Kelley Kristen | $375,250 |
Source: Public Records
Tax History
| Year | Tax Paid | Tax Assessment Tax Assessment Total Assessment is a certain percentage of the fair market value that is determined by local assessors to be the total taxable value of land and additions on the property. | Land | Improvement |
|---|---|---|---|---|
| 2025 | $5,524 | $546,900 | $213,000 | $333,900 |
| 2024 | $5,460 | $531,600 | $202,900 | $328,700 |
| 2023 | $5,146 | $492,400 | $187,900 | $304,500 |
| 2022 | $5,102 | $445,200 | $174,000 | $271,200 |
| 2021 | $4,575 | $389,700 | $174,000 | $215,700 |
| 2020 | $4,321 | $362,500 | $174,000 | $188,500 |
| 2019 | $4,013 | $331,100 | $167,300 | $163,800 |
| 2018 | $3,919 | $313,500 | $159,300 | $154,200 |
| 2017 | $3,720 | $290,400 | $151,700 | $138,700 |
| 2016 | $3,602 | $281,400 | $145,900 | $135,500 |
| 2015 | $3,474 | $269,300 | $145,900 | $123,400 |
| 2014 | $3,410 | $256,400 | $135,800 | $120,600 |
Source: Public Records
Map
Nearby Homes
- 33 Congress St
- 107 Summer St
- 82 Lester Ln
- 15 Summer St
- 19 Vine St Unit 3
- 19 Vine St Unit 2
- 116 Greenvale Ave
- 11 Richmond St
- 25 Richmond St
- 46 Roosevelt Rd
- 122 Washington St Unit Twenty-two
- 747 Middle St
- 8 Tara Dr Unit 4
- 8 Tara Dr Unit 5
- 211 Roosevelt Rd
- 37 Lantern Ln
- 165 Lake Shore Dr
- 41 Lantern Ln
- 270 Middle St
- 209 Lake St Unit 65
Your Personal Tour Guide
Ask me questions while you tour the home.