352 Grover Rd Cedartown, GA 30125
Estimated Value: $247,000 - $342,000
3
Beds
3
Baths
2,163
Sq Ft
$138/Sq Ft
Est. Value
About This Home
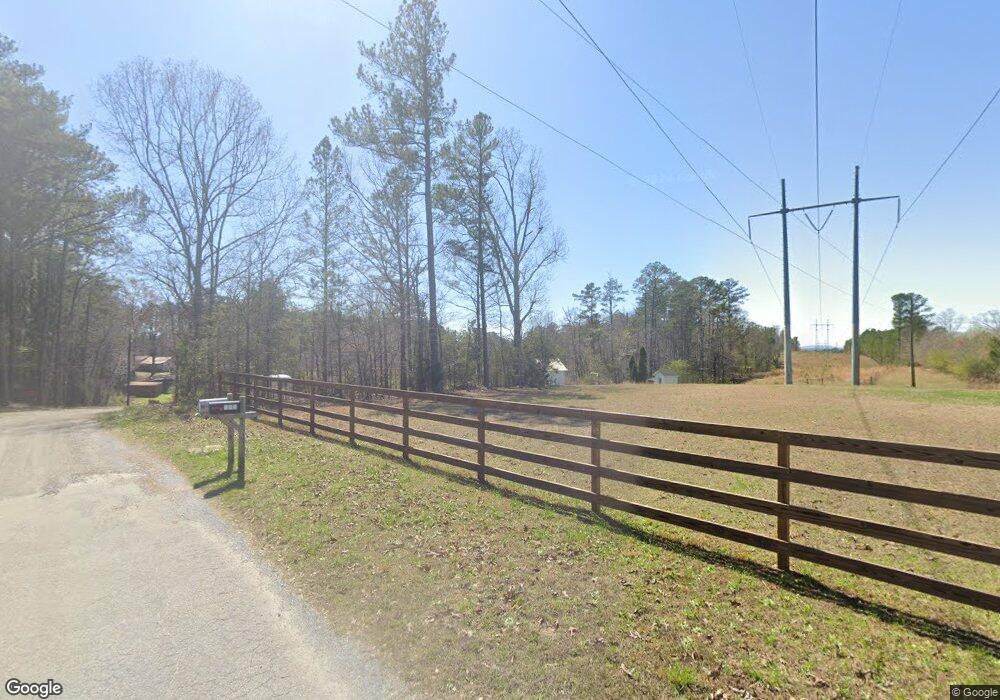
This home is located at 352 Grover Rd, Cedartown, GA 30125 and is currently estimated at $298,269, approximately $137 per square foot. 352 Grover Rd is a home located in Polk County with nearby schools including Vineyard Harvester Christian Academy.
Ownership History
Date
Name
Owned For
Owner Type
Purchase Details
Closed on
Nov 24, 2021
Sold by
Jones Ronny H
Bought by
England Phoenix and Morgan Jordan
Current Estimated Value
Purchase Details
Closed on
Sep 25, 1998
Sold by
Verdin Candelario and Verdin Nancy
Bought by
Jones Ronny H and Jones Karen A
Purchase Details
Closed on
Aug 15, 1995
Sold by
Jones Ronny H and Jones Karen A
Bought by
Verdin Candelario and Verdin Nancy
Purchase Details
Closed on
Mar 2, 1984
Sold by
Guthrie Betty J
Bought by
Jones Ronny and Jones Karen
Purchase Details
Closed on
Feb 29, 1984
Bought by
Guthrie Betty J
Purchase Details
Closed on
Feb 20, 1984
Sold by
Guthrie Jimmie G
Bought by
Guthrie Betty J
Purchase Details
Closed on
Nov 24, 1971
Bought by
Guthrie Jimmie G
Create a Home Valuation Report for This Property
The Home Valuation Report is an in-depth analysis detailing your home's value as well as a comparison with similar homes in the area
Home Values in the Area
Average Home Value in this Area
Purchase History
| Date | Buyer | Sale Price | Title Company |
|---|---|---|---|
| England Phoenix | $205,000 | -- | |
| Jones Ronny H | $28,100 | -- | |
| Verdin Candelario | $38,800 | -- | |
| Jones Ronny | -- | -- | |
| Guthrie Betty J | -- | -- | |
| Guthrie Betty J | -- | -- | |
| Guthrie Jimmie G | -- | -- |
Source: Public Records
Tax History Compared to Growth
Tax History
| Year | Tax Paid | Tax Assessment Tax Assessment Total Assessment is a certain percentage of the fair market value that is determined by local assessors to be the total taxable value of land and additions on the property. | Land | Improvement |
|---|---|---|---|---|
| 2024 | $2,247 | $109,477 | $9,440 | $100,037 |
| 2023 | $1,867 | $80,670 | $9,440 | $71,230 |
| 2022 | $1,594 | $67,188 | $6,294 | $60,894 |
| 2021 | $1,615 | $67,188 | $6,294 | $60,894 |
| 2020 | $1,618 | $67,188 | $6,294 | $60,894 |
| 2019 | $1,346 | $50,110 | $6,294 | $43,816 |
| 2018 | $1,349 | $48,967 | $6,294 | $42,673 |
| 2017 | $1,332 | $48,967 | $6,294 | $42,673 |
| 2016 | $1,279 | $47,005 | $6,818 | $40,187 |
| 2015 | $1,288 | $47,207 | $6,818 | $40,388 |
| 2014 | $1,298 | $47,207 | $6,818 | $40,388 |
Source: Public Records
Map
Nearby Homes
- 728 Hutto Rd
- 200 Kelly Rd
- 209 Ridgewood Rd
- 202 Ridgewood Rd
- 256 Cuzzort Rd
- 0 Coaling Rd Unit 9221-D 10352096
- 0 Coaling Rd Unit 9221-C 10352086
- 0 Coaling Rd Unit 9221 10352063
- 0 Coaling Rd Unit 9221-B 10352079
- 10 Woodglen Dr
- 618 Valley Rd
- 645 Valley Rd
- 660 Valley Rd
- 387 Lindsey Chapel Rd
- 662 Hillside Dr
- 0 Blanche Rd Unit 10609468
- 0 Blanche Rd Unit 7652978
- 1101 East Ave
- 94 Wimberly Hill Loop
- 00 Juliette St