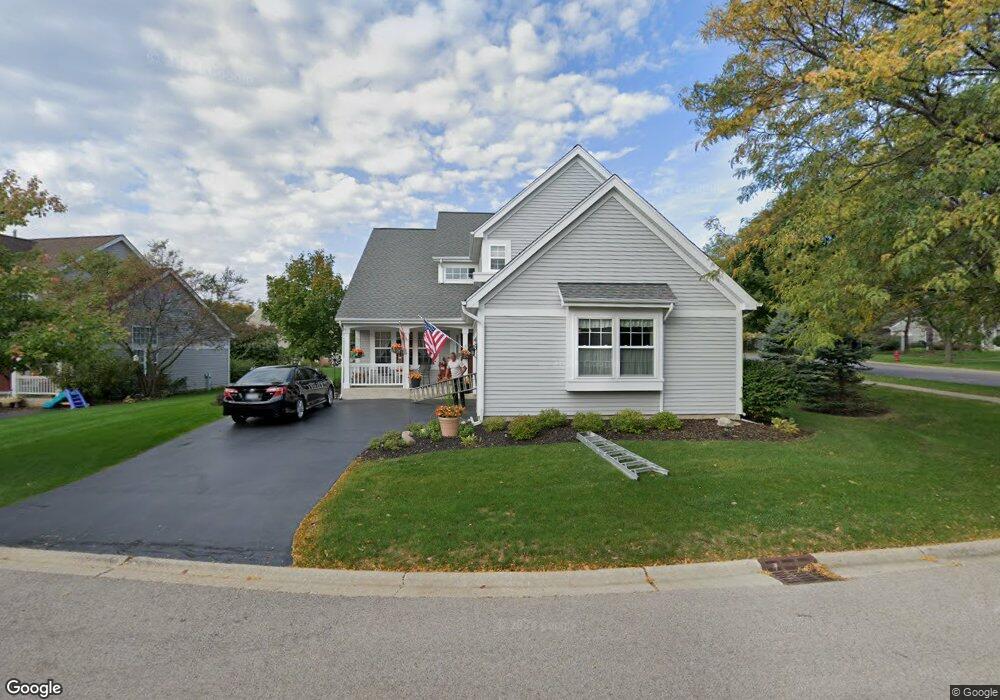
352 Hampton Ct Crystal Lake, IL 60012
Estimated Value: $428,000 - $499,000
3
Beds
8
Baths
2,562
Sq Ft
$178/Sq Ft
Est. Value
About This Home
This home is located at 352 Hampton Ct, Crystal Lake, IL 60012 and is currently estimated at $455,539, approximately $177 per square foot. 352 Hampton Ct is a home located in McHenry County with nearby schools including Husmann Elementary School, Hannah Beardsley Middle School, and Prairie Ridge High School.
Ownership History
Date
Name
Owned For
Owner Type
Purchase Details
Closed on
Mar 27, 2017
Sold by
Torres Jamie Chapman
Bought by
Chapman Torres Jamie
Current Estimated Value
Home Financials for this Owner
Home Financials are based on the most recent Mortgage that was taken out on this home.
Original Mortgage
$102,500
Outstanding Balance
$85,037
Interest Rate
4.1%
Mortgage Type
New Conventional
Estimated Equity
$370,502
Purchase Details
Closed on
May 27, 2008
Sold by
Chapman Jamie P
Bought by
Jamie P Chapman Trust
Purchase Details
Closed on
Jul 19, 1996
Sold by
American National Bk & Tr Co Of Chicago
Bought by
Chapman Jamie P
Home Financials for this Owner
Home Financials are based on the most recent Mortgage that was taken out on this home.
Original Mortgage
$123,600
Interest Rate
8.47%
Create a Home Valuation Report for This Property
The Home Valuation Report is an in-depth analysis detailing your home's value as well as a comparison with similar homes in the area
Home Values in the Area
Average Home Value in this Area
Purchase History
| Date | Buyer | Sale Price | Title Company |
|---|---|---|---|
| Chapman Torres Jamie | -- | None Available | |
| Jamie P Chapman Trust | -- | None Available | |
| Chapman Jamie P | $206,000 | -- |
Source: Public Records
Mortgage History
| Date | Status | Borrower | Loan Amount |
|---|---|---|---|
| Open | Chapman Torres Jamie | $102,500 | |
| Closed | Chapman Jamie P | $123,600 |
Source: Public Records
Tax History Compared to Growth
Tax History
| Year | Tax Paid | Tax Assessment Tax Assessment Total Assessment is a certain percentage of the fair market value that is determined by local assessors to be the total taxable value of land and additions on the property. | Land | Improvement |
|---|---|---|---|---|
| 2024 | $6,114 | $123,025 | $19,597 | $103,428 |
| 2023 | $6,656 | $110,326 | $17,574 | $92,752 |
| 2022 | $8,647 | $101,044 | $17,575 | $83,469 |
| 2021 | $7,485 | $94,735 | $16,478 | $78,257 |
| 2020 | $7,586 | $91,895 | $15,984 | $75,911 |
| 2019 | $7,751 | $87,369 | $15,197 | $72,172 |
| 2018 | $8,653 | $89,634 | $14,275 | $75,359 |
| 2017 | $8,755 | $85,873 | $13,676 | $72,197 |
| 2016 | $8,681 | $81,932 | $13,048 | $68,884 |
| 2013 | -- | $77,712 | $12,418 | $65,294 |
Source: Public Records
Map
Nearby Homes
- 0 Millennium Dr
- 462 Kelly Ln
- Lot 24 Knaack Blvd
- Lots 22,23,24,31,32 Knaack Blvd
- 221 Mistwood Ln
- 797 Silk Oak Ln Unit 797
- 532 Nunda Trail
- 5804 Terra Cotta Rd
- 845 E Terra Cotta Ave
- 4915 Terra Cotta Rd
- 542 Blackthorn Dr
- 5419 Rita Ave
- 539 Primrose Ln
- 546 Cimmaron Cir
- 654 Cassia Ct
- 648 Cassia Ct
- 660 Cassia Ct
- 632 Cassia Ct
- 634 Cassia Ct
- 636 Cassia Ct
- 346 Hampton Ct
- 349 Sedgewick Ct
- 355 Hampton Ct
- 343 Sedgewick Ct
- 340 Hampton Ct
- 372 Sherbrooke Ct Unit 1
- 349 Hampton Ct
- 370 Sherbrooke Ct
- 337 Sedgewick Ct
- 343 Hampton Ct
- 701 Nashua Ct
- 373 Narragansett Ct
- 334 Hampton Ct Unit 1
- 378 Sherbrooke Ct
- 328 Hampton Ct
- 337 Hampton Ct Unit 1
- 331 Sedgewick Ct
- 381 Narragansett Ct
- 350 Sedgewick Ct
- 325 Hampton Ct