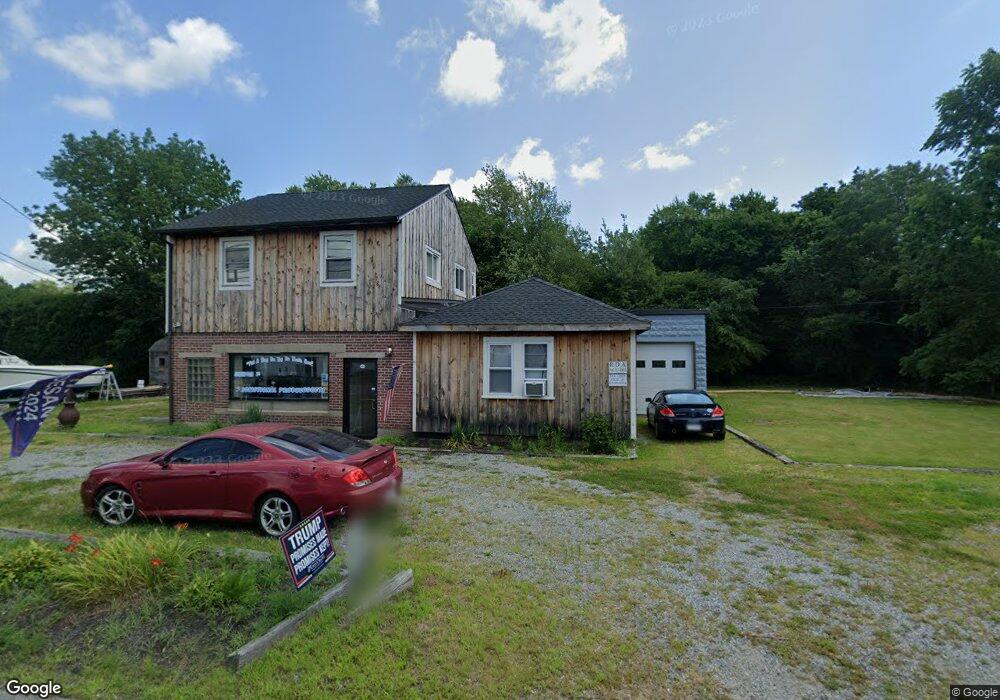
352 Main St Acushnet, MA 02743
Upper Acushnet NeighborhoodEstimated Value: $735,000
4
Beds
2
Baths
1,625
Sq Ft
$452/Sq Ft
Est. Value
About This Home
This home is located at 352 Main St, Acushnet, MA 02743 and is currently priced at $735,000, approximately $452 per square foot. 352 Main St is a home located in Bristol County with nearby schools including Acushnet Elementary School, Albert F Ford Middle School, and Alma Del Mar Charter School.
Ownership History
Date
Name
Owned For
Owner Type
Purchase Details
Closed on
Oct 3, 1995
Sold by
Denman Linda T
Bought by
Joseph Frank P
Current Estimated Value
Home Financials for this Owner
Home Financials are based on the most recent Mortgage that was taken out on this home.
Original Mortgage
$45,000
Interest Rate
7.89%
Mortgage Type
Commercial
Create a Home Valuation Report for This Property
The Home Valuation Report is an in-depth analysis detailing your home's value as well as a comparison with similar homes in the area
Home Values in the Area
Average Home Value in this Area
Purchase History
| Date | Buyer | Sale Price | Title Company |
|---|---|---|---|
| Joseph Frank P | $55,000 | -- |
Source: Public Records
Mortgage History
| Date | Status | Borrower | Loan Amount |
|---|---|---|---|
| Open | Joseph Frank P | $87,000 | |
| Closed | Joseph Frank P | $116,250 | |
| Closed | Joseph Frank P | $20,000 | |
| Closed | Joseph Frank P | $45,000 |
Source: Public Records
Tax History
| Year | Tax Paid | Tax Assessment Tax Assessment Total Assessment is a certain percentage of the fair market value that is determined by local assessors to be the total taxable value of land and additions on the property. | Land | Improvement |
|---|---|---|---|---|
| 2025 | $0 | $360,200 | $185,100 | $175,100 |
| 2024 | -- | $332,200 | $174,200 | $158,000 |
| 2023 | $0 | $314,700 | $163,400 | $151,300 |
| 2022 | $0 | $289,600 | $152,500 | $137,100 |
| 2021 | $4,696 | $265,400 | $141,600 | $123,800 |
| 2020 | $0 | $265,400 | $141,600 | $123,800 |
| 2019 | $2,744 | $233,400 | $126,300 | $107,100 |
| 2018 | $30 | $229,100 | $122,000 | $107,100 |
| 2017 | $4,375 | $221,800 | $122,000 | $99,800 |
| 2016 | $3,269 | $214,499 | $119,800 | $94,699 |
| 2015 | $3,269 | $214,499 | $119,800 | $94,699 |
Source: Public Records
Map
Nearby Homes
Your Personal Tour Guide
Ask me questions while you tour the home.