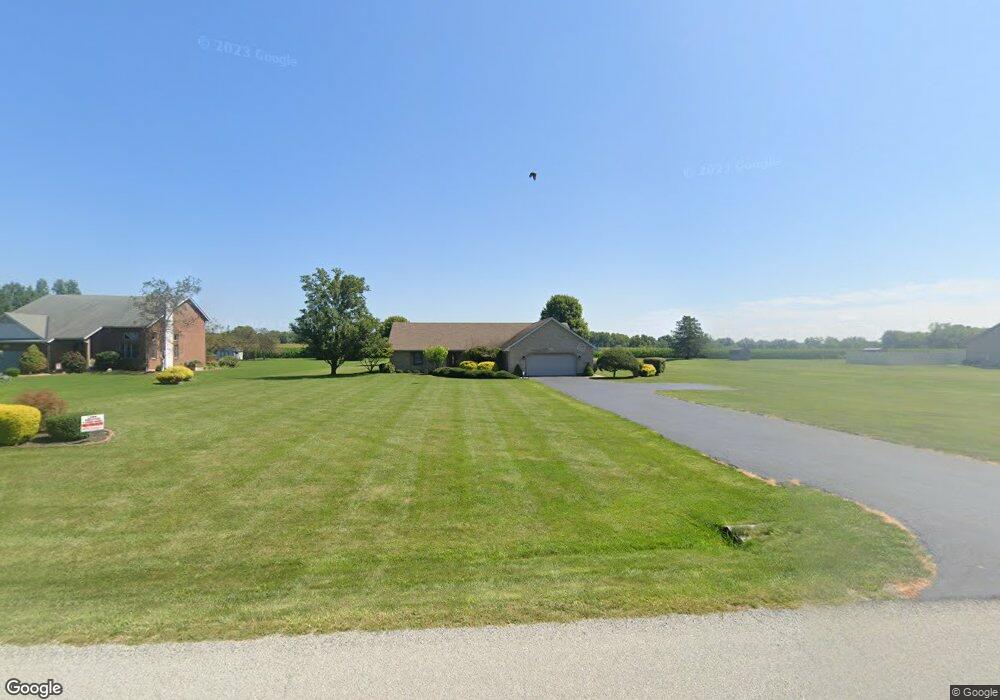
352 Mitchell Rd Wilmington, OH 45177
Estimated Value: $385,000 - $430,000
3
Beds
2
Baths
2,402
Sq Ft
$168/Sq Ft
Est. Value
About This Home
This home is located at 352 Mitchell Rd, Wilmington, OH 45177 and is currently estimated at $402,708, approximately $167 per square foot. 352 Mitchell Rd is a home located in Clinton County with nearby schools including East End Elementary School, Roy E. Holmes Elementary School, and Denver Place Elementary School.
Ownership History
Date
Name
Owned For
Owner Type
Purchase Details
Closed on
Feb 24, 2005
Sold by
Billups Ronald O and Billups Carolyn S
Bought by
Billups Ronald O and Billups Carolyn S
Current Estimated Value
Purchase Details
Closed on
Mar 6, 1996
Bought by
Denlinger Timothy L
Create a Home Valuation Report for This Property
The Home Valuation Report is an in-depth analysis detailing your home's value as well as a comparison with similar homes in the area
Home Values in the Area
Average Home Value in this Area
Purchase History
| Date | Buyer | Sale Price | Title Company |
|---|---|---|---|
| Billups Ronald O | -- | -- | |
| Denlinger Timothy L | $148,000 | -- |
Source: Public Records
Tax History Compared to Growth
Tax History
| Year | Tax Paid | Tax Assessment Tax Assessment Total Assessment is a certain percentage of the fair market value that is determined by local assessors to be the total taxable value of land and additions on the property. | Land | Improvement |
|---|---|---|---|---|
| 2024 | $3,013 | $105,950 | $11,870 | $94,080 |
| 2023 | $3,013 | $105,950 | $11,870 | $94,080 |
| 2022 | $2,526 | $84,340 | $9,090 | $75,250 |
| 2021 | $2,555 | $84,340 | $9,090 | $75,250 |
| 2020 | $2,469 | $84,340 | $9,090 | $75,250 |
| 2019 | $2,221 | $71,360 | $8,560 | $62,800 |
| 2018 | $2,242 | $71,360 | $8,560 | $62,800 |
| 2017 | $2,179 | $71,360 | $8,560 | $62,800 |
| 2016 | $1,645 | $55,670 | $9,850 | $45,820 |
| 2015 | $1,644 | $55,670 | $9,850 | $45,820 |
| 2013 | $1,653 | $54,340 | $9,850 | $44,490 |
Source: Public Records
Map
Nearby Homes
- 493 Mitchell Rd
- 2536 Wayne Rd
- 629 Oakridge Dr
- 1706 Woodside Dr
- 1244 Mayfair Dr
- 1247 Peggy Ln
- 1351 Mayfair Dr
- 987 N Nelson Ave
- 585 Silverado Dr
- 588 John Chambers Dr
- 52 Maple Point Ct
- 909 W Main St
- 1087 Warren Dr
- 166 Glenwood Cir
- 1985 State Route 730
- 423 Howard St
- 373 Thorne Ave
- 584 Howard St
- 1685 N Webb Rd
- 2746 State Route 730
- 388 Mitchell Rd
- 306 Mitchell Rd
- 414 Mitchell Rd
- 278 Mitchell Rd
- 367 Mitchell Rd
- 297 Mitchell Rd
- 426 Mitchell Rd
- 264 Mitchell Rd
- 397 Mitchell Rd
- 417 Mitchell Rd
- 458 Mitchell Rd
- 257 Mitchell Rd
- 236 Mitchell Rd
- 437 Mitchell Rd
- 490 Mitchell Rd
- 239 Mitchell Rd
- 528 Mitchell Rd
- 193 Mitchell Rd
- 98 Mitchell Rd
- 477 Mitchell Rd