352 Neponset St Unit H Canton, MA 02021
Estimated Value: $360,000 - $560,000
2
Beds
1
Bath
871
Sq Ft
$475/Sq Ft
Est. Value
About This Home
This home is located at 352 Neponset St Unit H, Canton, MA 02021 and is currently estimated at $414,103, approximately $475 per square foot. 352 Neponset St Unit H is a home located in Norfolk County with nearby schools including Canton High School, St. John the Evangelist School, and Chabad Day School of School.
Ownership History
Date
Name
Owned For
Owner Type
Purchase Details
Closed on
Oct 1, 2003
Sold by
Koronios George G and Koronios Kathy
Bought by
Landes John B and Landes Lindsay
Current Estimated Value
Purchase Details
Closed on
Sep 2, 1997
Sold by
Birol Cuneyt and Birol Aysegul
Bought by
Koronics George G and Koronics Kathy
Home Financials for this Owner
Home Financials are based on the most recent Mortgage that was taken out on this home.
Original Mortgage
$71,900
Interest Rate
7.41%
Mortgage Type
Purchase Money Mortgage
Purchase Details
Closed on
Feb 2, 1995
Sold by
Assocslp P Christopher
Bought by
Birol Cuneyt and Birol Aysegul
Home Financials for this Owner
Home Financials are based on the most recent Mortgage that was taken out on this home.
Original Mortgage
$34,500
Interest Rate
9.13%
Mortgage Type
Purchase Money Mortgage
Purchase Details
Closed on
Apr 6, 1993
Sold by
Fhlmc
Bought by
P Christopher Assocs
Purchase Details
Closed on
Jul 21, 1992
Sold by
King Stephen M Est
Bought by
Fhlmc
Create a Home Valuation Report for This Property
The Home Valuation Report is an in-depth analysis detailing your home's value as well as a comparison with similar homes in the area
Home Values in the Area
Average Home Value in this Area
Purchase History
| Date | Buyer | Sale Price | Title Company |
|---|---|---|---|
| Landes John B | $221,000 | -- | |
| Koronics George G | $90,000 | -- | |
| Birol Cuneyt | $69,000 | -- | |
| P Christopher Assocs | $66,000 | -- | |
| Fhlmc | $82,000 | -- |
Source: Public Records
Mortgage History
| Date | Status | Borrower | Loan Amount |
|---|---|---|---|
| Previous Owner | Fhlmc | $71,900 | |
| Previous Owner | Fhlmc | $34,500 |
Source: Public Records
Tax History Compared to Growth
Tax History
| Year | Tax Paid | Tax Assessment Tax Assessment Total Assessment is a certain percentage of the fair market value that is determined by local assessors to be the total taxable value of land and additions on the property. | Land | Improvement |
|---|---|---|---|---|
| 2025 | $3,145 | $318,000 | $0 | $318,000 |
| 2024 | $2,878 | $288,700 | $0 | $288,700 |
| 2023 | $2,801 | $265,000 | $0 | $265,000 |
| 2022 | $2,818 | $248,300 | $0 | $248,300 |
| 2021 | $2,832 | $232,100 | $0 | $232,100 |
| 2020 | $2,730 | $223,200 | $0 | $223,200 |
| 2019 | $2,668 | $215,200 | $0 | $215,200 |
| 2018 | $2,477 | $199,400 | $0 | $199,400 |
| 2017 | $2,476 | $193,600 | $0 | $193,600 |
| 2016 | $2,416 | $188,900 | $0 | $188,900 |
| 2015 | $2,219 | $173,100 | $0 | $173,100 |
Source: Public Records
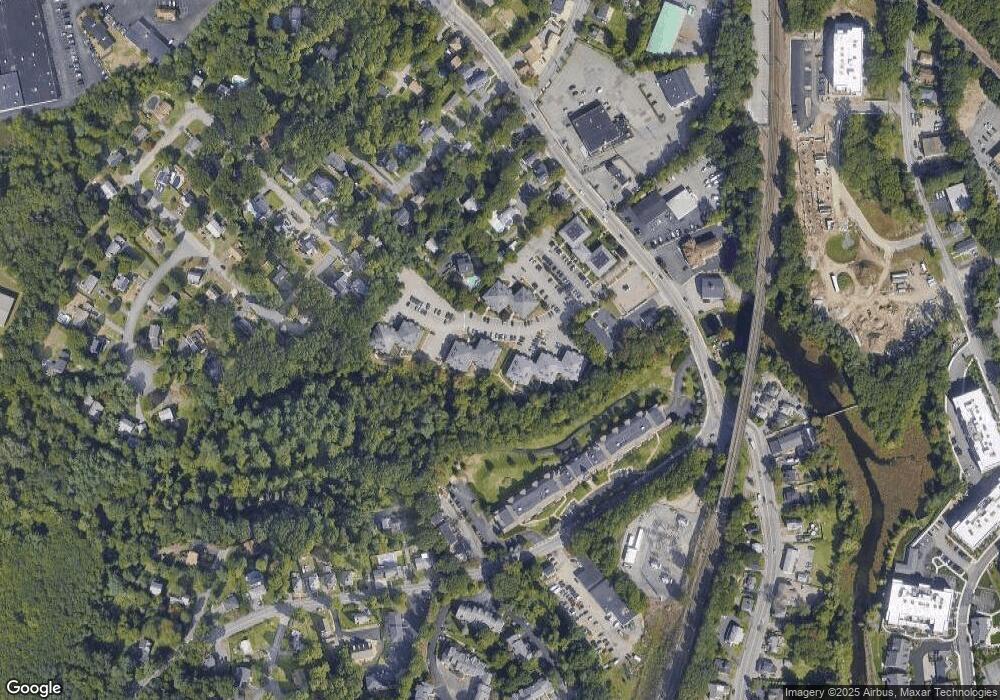
Map
Nearby Homes
- 354 Neponset St Unit M
- 356 Neponset St Unit E
- 59 Walpole St Unit 116
- 399 Neponset St Unit 106
- 399 Neponset St Unit 412
- 399 Neponset St Unit 206
- 399 Neponset St Unit 311
- 399 Neponset St Unit 105
- 399 Neponset St Unit 405
- 399 Neponset St Unit 110
- 399 Neponset St Unit 101
- 399 Neponset St Unit 310
- 399 Neponset St Unit 211
- 399 Neponset St Unit 104
- 399 Neponset St Unit 210
- 50 Coppersmith Way Unit 211
- 30 Coppersmith Way Unit 209
- 30 Coppersmith Way Unit 409
- 30 Coppersmith Way Unit 301
- 30 Coppersmith Way Unit 112
- 352 Neponset St Unit M
- 352 Neponset St Unit L
- 352 Neponset St Unit K
- 352 Neponset St Unit J
- 352 Neponset St Unit G
- 352 Neponset St Unit F
- 352 Neponset St Unit E
- 352 Neponset St Unit D
- 352 Neponset St Unit C
- 352 Neponset St Unit B
- 352 Neponset St Unit A
- 352 Neponset St Unit H,352
- 352 Neponset St Unit E,352
- 354 Neponset St Unit L
- 354 Neponset St Unit K
- 354 Neponset St Unit J
- 354 Neponset St Unit H
- 354 Neponset St Unit G
- 354 Neponset St Unit F
- 354 Neponset St Unit E