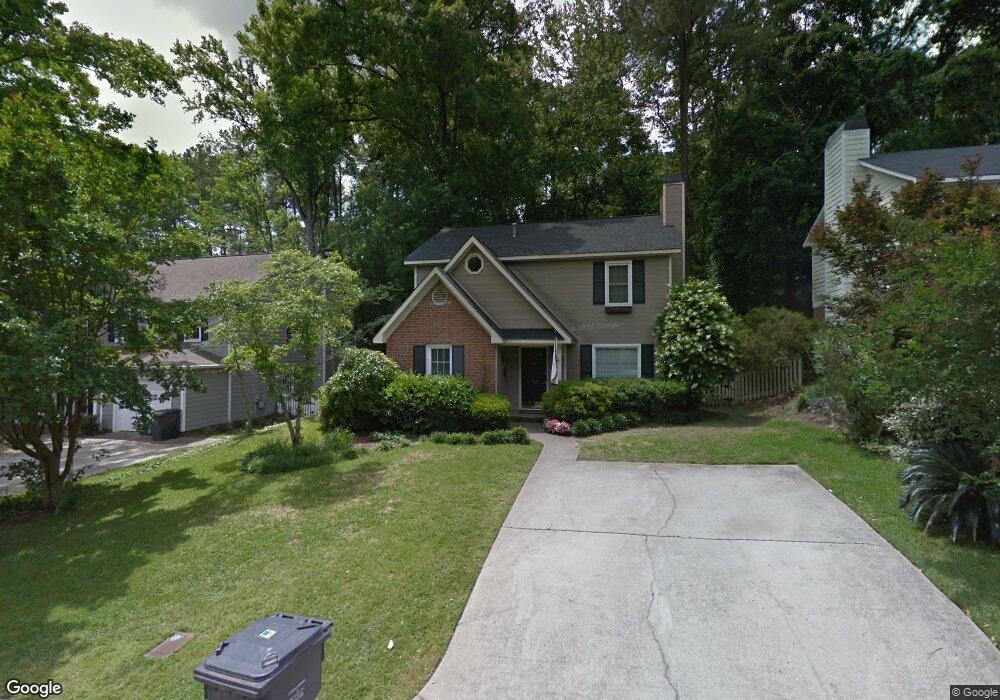
352 Old Salem Way Augusta, GA 30907
Estimated Value: $269,000 - $296,000
3
Beds
3
Baths
1,655
Sq Ft
$171/Sq Ft
Est. Value
About This Home
This home is located at 352 Old Salem Way, Augusta, GA 30907 and is currently estimated at $283,069, approximately $171 per square foot. 352 Old Salem Way is a home located in Columbia County with nearby schools including Roosevelt Elementary School, Northmore Elementary School, and Stevens Creek Elementary School.
Ownership History
Date
Name
Owned For
Owner Type
Purchase Details
Closed on
Aug 21, 2003
Sold by
Ratley Steven D and Ratley Traci S
Bought by
Hargrove William and Hargrove Candace D
Current Estimated Value
Home Financials for this Owner
Home Financials are based on the most recent Mortgage that was taken out on this home.
Original Mortgage
$130,945
Outstanding Balance
$59,004
Interest Rate
5.94%
Mortgage Type
FHA
Estimated Equity
$224,065
Purchase Details
Closed on
Aug 1, 2001
Sold by
Ramp Sharon B
Bought by
Ratley Steven D and Ratley Traci S
Home Financials for this Owner
Home Financials are based on the most recent Mortgage that was taken out on this home.
Original Mortgage
$93,920
Interest Rate
7.09%
Create a Home Valuation Report for This Property
The Home Valuation Report is an in-depth analysis detailing your home's value as well as a comparison with similar homes in the area
Home Values in the Area
Average Home Value in this Area
Purchase History
| Date | Buyer | Sale Price | Title Company |
|---|---|---|---|
| Hargrove William | $133,000 | -- | |
| Ratley Steven D | $117,400 | -- |
Source: Public Records
Mortgage History
| Date | Status | Borrower | Loan Amount |
|---|---|---|---|
| Open | Hargrove William | $130,945 | |
| Previous Owner | Ratley Steven D | $93,920 | |
| Closed | Ratley Steven D | $11,740 |
Source: Public Records
Tax History Compared to Growth
Tax History
| Year | Tax Paid | Tax Assessment Tax Assessment Total Assessment is a certain percentage of the fair market value that is determined by local assessors to be the total taxable value of land and additions on the property. | Land | Improvement |
|---|---|---|---|---|
| 2025 | $1,178 | $48,868 | $24,604 | $24,264 |
| 2024 | $2,525 | $100,651 | $21,304 | $79,347 |
| 2023 | $2,525 | $86,056 | $19,504 | $66,552 |
| 2022 | $2,029 | $77,764 | $17,804 | $59,960 |
| 2021 | $1,845 | $67,643 | $16,204 | $51,439 |
| 2020 | $1,866 | $67,019 | $15,804 | $51,215 |
| 2019 | $1,838 | $66,032 | $14,304 | $51,728 |
| 2018 | $1,841 | $65,896 | $14,304 | $51,592 |
| 2017 | $1,647 | $58,709 | $12,804 | $45,905 |
| 2016 | $1,445 | $53,406 | $10,780 | $42,626 |
| 2015 | $1,496 | $55,186 | $12,380 | $42,806 |
| 2014 | $1,439 | $52,451 | $11,180 | $41,271 |
Source: Public Records
Map
Nearby Homes
- 333 Old Salem Way
- 3555 Watervale Way
- 307 Old Salem Way
- 705 Cool Brook Ct
- 3593 Westhampton Dr
- 3503 Wakefield Ct
- 414 Parliament Rd
- 271 Watervale Rd
- 3597 Parliament Ln
- 1094 Hampstead Place
- 816 Brookfield Pkwy
- 1119 Hampstead Place
- 3637 Foxfire Place
- 3667 Foxfire Place
- 320 Furys Ferry Rd
- 2044 Bridgewater Dr
- 2020 Autumn Chase
- 408 Hastings Place
- 4120 Shady Oaks Dr
- 2032 Pheasant Creek Dr
- 354 Old Salem Way
- 348 Old Salem Way
- 356 Old Salem Way
- 343 Old Salem Way
- 337 Old Salem Way
- 358 Old Salem Way
- 346 Old Salem Way
- 345 Old Salem Way
- 335 Old Salem Way
- 347 Old Salem Way
- 360 Old Salem Way
- 344 Old Salem Way
- 349 Old Salem Way
- 342 Old Salem Way
- 340 Old Salem Way
- 362 Old Salem Way
- 338 Old Salem Way
- 331 Old Salem Way
- 334 Old Salem Way