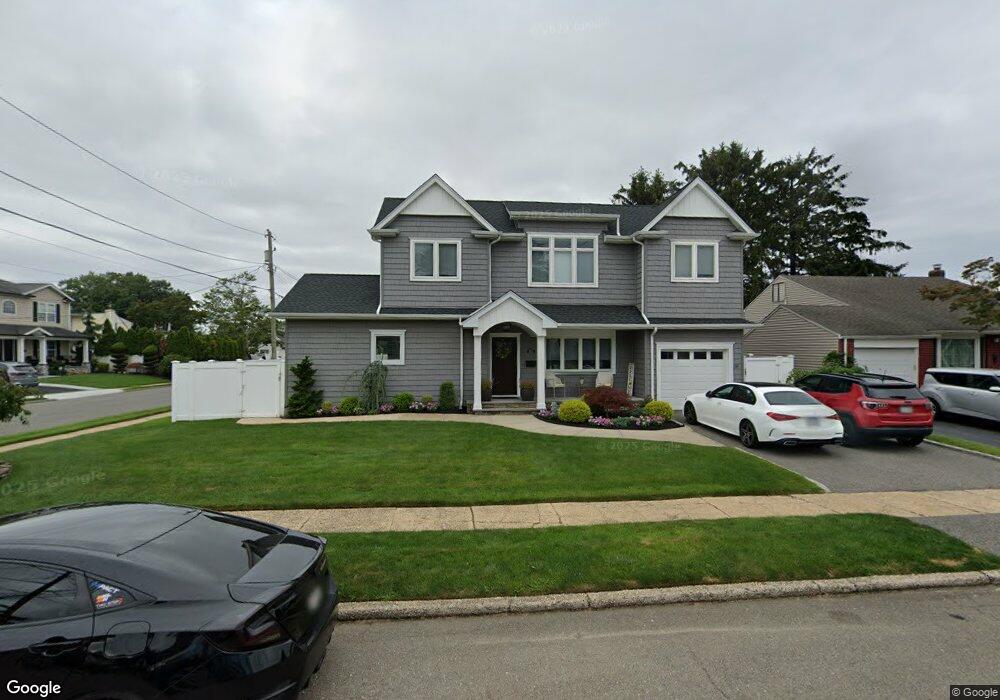
352 Philadelphia Ave Massapequa Park, NY 11762
Estimated Value: $871,000 - $909,232
4
Beds
2
Baths
2,194
Sq Ft
$406/Sq Ft
Est. Value
About This Home
This home is located at 352 Philadelphia Ave, Massapequa Park, NY 11762 and is currently estimated at $890,116, approximately $405 per square foot. 352 Philadelphia Ave is a home located in Nassau County with nearby schools including Berner Middle School, Massapequa High School - Ames Campus, and Massapequa High School.
Ownership History
Date
Name
Owned For
Owner Type
Purchase Details
Closed on
Jul 25, 2022
Sold by
Keough Edward
Bought by
Keough Edward and Keough Natalia Andrea
Current Estimated Value
Purchase Details
Closed on
Jan 26, 2018
Sold by
Harrington Patrick and Connor Virginia O
Bought by
Keough Edward
Home Financials for this Owner
Home Financials are based on the most recent Mortgage that was taken out on this home.
Original Mortgage
$460,000
Outstanding Balance
$389,186
Interest Rate
3.95%
Mortgage Type
New Conventional
Estimated Equity
$500,930
Purchase Details
Closed on
Jan 20, 2017
Sold by
Amorosino Thelma and Amorosino Robert A
Bought by
Harrington Patrick and O'Connor Virginia
Home Financials for this Owner
Home Financials are based on the most recent Mortgage that was taken out on this home.
Original Mortgage
$243,750
Interest Rate
4.3%
Mortgage Type
New Conventional
Create a Home Valuation Report for This Property
The Home Valuation Report is an in-depth analysis detailing your home's value as well as a comparison with similar homes in the area
Home Values in the Area
Average Home Value in this Area
Purchase History
| Date | Buyer | Sale Price | Title Company |
|---|---|---|---|
| Keough Edward | -- | Judicial Title | |
| Keough Edward | $575,000 | -- | |
| Harrington Patrick | $325,000 | Stewart Title Insurance Comp |
Source: Public Records
Mortgage History
| Date | Status | Borrower | Loan Amount |
|---|---|---|---|
| Open | Keough Edward | $460,000 | |
| Previous Owner | Harrington Patrick | $243,750 |
Source: Public Records
Tax History Compared to Growth
Tax History
| Year | Tax Paid | Tax Assessment Tax Assessment Total Assessment is a certain percentage of the fair market value that is determined by local assessors to be the total taxable value of land and additions on the property. | Land | Improvement |
|---|---|---|---|---|
| 2025 | $12,615 | $664 | $198 | $466 |
| 2024 | $3,166 | $471 | $192 | $279 |
| 2023 | $12,156 | $491 | $200 | $291 |
| 2022 | $12,156 | $499 | $203 | $296 |
| 2021 | $12,201 | $527 | $215 | $312 |
| 2020 | $14,275 | $805 | $629 | $176 |
| 2019 | $4,118 | $892 | $697 | $195 |
| 2018 | $10,413 | $892 | $0 | $0 |
| 2017 | $1,467 | $892 | $697 | $195 |
| 2016 | $3,956 | $892 | $697 | $195 |
| 2015 | $2,154 | $892 | $697 | $195 |
| 2014 | $2,154 | $892 | $697 | $195 |
| 2013 | $2,009 | $892 | $697 | $195 |
Source: Public Records
Map
Nearby Homes
- 356 Philadelphia Ave
- 351 Ocean Ave
- 355 Ocean Ave
- 360 Philadelphia Ave
- 348 Philadelphia Ave
- 362 Cypress St
- 351 Philadelphia Ave
- 359 Ocean Ave
- 355 Philadelphia Ave
- 349 Ocean Ave
- 364 Philadelphia Ave
- 349 Philadelphia Ave
- 359 Philadelphia Ave
- 363 Ocean Ave
- 338 Philadelphia Ave
- 363 Philadelphia Ave
- 376 Cypress St
- 368 Philadelphia Ave
- 352 Eastlake Ave