352 Rice Ct Augusta, GA 30907
Estimated Value: $217,597 - $243,000
3
Beds
2
Baths
1,400
Sq Ft
$164/Sq Ft
Est. Value
About This Home
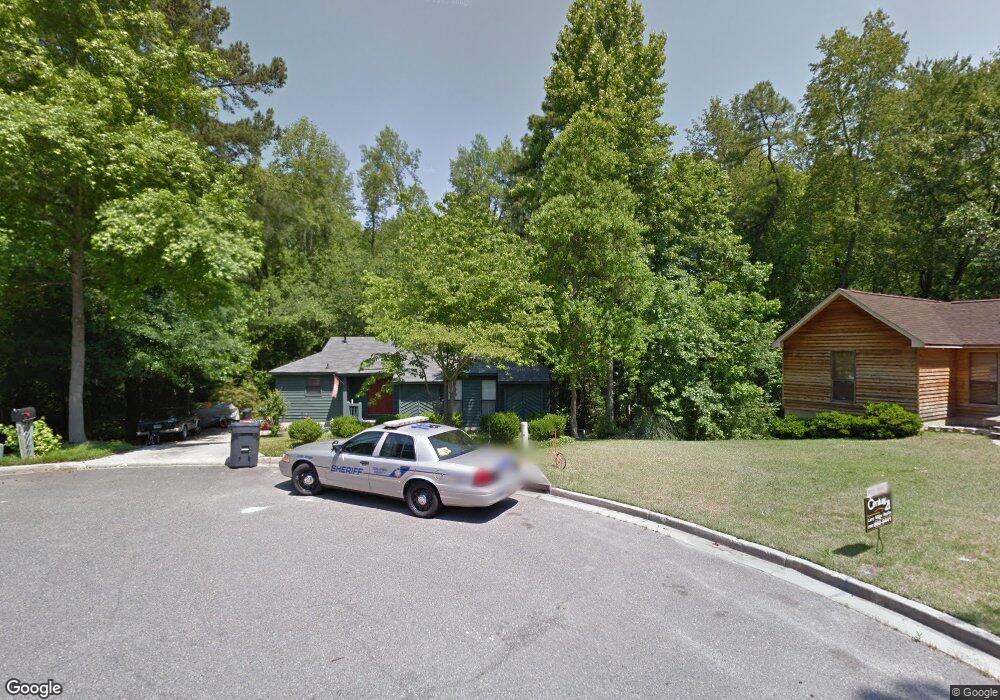
This home is located at 352 Rice Ct, Augusta, GA 30907 and is currently estimated at $229,649, approximately $164 per square foot. 352 Rice Ct is a home located in Columbia County with nearby schools including Brookwood Elementary School, Evans Middle School, and Evans High School.
Ownership History
Date
Name
Owned For
Owner Type
Purchase Details
Closed on
Jun 3, 2013
Sold by
Fuller Adam
Bought by
Fuller Donald A
Current Estimated Value
Home Financials for this Owner
Home Financials are based on the most recent Mortgage that was taken out on this home.
Original Mortgage
$117,954
Outstanding Balance
$83,169
Interest Rate
3.37%
Mortgage Type
New Conventional
Estimated Equity
$146,480
Purchase Details
Closed on
Jun 12, 2006
Sold by
Foust Travis
Bought by
Fuller Adam
Home Financials for this Owner
Home Financials are based on the most recent Mortgage that was taken out on this home.
Original Mortgage
$115,192
Interest Rate
6.49%
Mortgage Type
FHA
Purchase Details
Closed on
Jun 29, 2005
Sold by
Rawlins William D
Bought by
Foust Travis
Home Financials for this Owner
Home Financials are based on the most recent Mortgage that was taken out on this home.
Original Mortgage
$15,000
Interest Rate
5.54%
Mortgage Type
New Conventional
Create a Home Valuation Report for This Property
The Home Valuation Report is an in-depth analysis detailing your home's value as well as a comparison with similar homes in the area
Home Values in the Area
Average Home Value in this Area
Purchase History
| Date | Buyer | Sale Price | Title Company |
|---|---|---|---|
| Fuller Donald A | $121,800 | -- | |
| Fuller Donald A | $121,729 | -- | |
| Fuller Adam | $117,000 | -- | |
| Foust Travis | $8,200 | -- |
Source: Public Records
Mortgage History
| Date | Status | Borrower | Loan Amount |
|---|---|---|---|
| Open | Fuller Donald A | $117,954 | |
| Closed | Fuller Donald A | $117,954 | |
| Previous Owner | Fuller Adam | $115,192 | |
| Previous Owner | Foust Travis | $15,000 |
Source: Public Records
Tax History
| Year | Tax Paid | Tax Assessment Tax Assessment Total Assessment is a certain percentage of the fair market value that is determined by local assessors to be the total taxable value of land and additions on the property. | Land | Improvement |
|---|---|---|---|---|
| 2025 | $1,829 | $74,205 | $16,404 | $57,801 |
| 2024 | $2,036 | $79,142 | $17,304 | $61,838 |
| 2023 | $2,036 | $76,037 | $17,104 | $58,933 |
| 2022 | $1,776 | $66,092 | $14,404 | $51,688 |
| 2021 | $1,627 | $57,677 | $12,504 | $45,173 |
| 2020 | $1,455 | $50,258 | $11,604 | $38,654 |
| 2019 | $1,435 | $49,546 | $10,604 | $38,942 |
| 2018 | $1,473 | $50,764 | $10,704 | $40,060 |
| 2017 | $1,365 | $46,696 | $10,604 | $36,092 |
| 2016 | $1,278 | $45,209 | $9,880 | $35,329 |
| 2015 | $1,264 | $44,610 | $9,980 | $34,630 |
| 2014 | $1,246 | $43,408 | $9,180 | $34,228 |
Source: Public Records
Map
Nearby Homes
- 4367 Quail Creek Rd
- 351 Pellet Ct
- 4357 Quail Creek Rd
- 233 Kestwick Dr W
- 654 Clinton Way W
- 4350 Quail Creek Rd
- 213 S Belair Rd
- 302 Laurel Place
- 186 Kestwick Dr W
- 4507 Colonial Rd
- 524 Casey Ct
- 4130 Knollcrest Cir N
- 4127 Meriden Dr
- 606 Todd Rd
- 4518 Colonial Rd
- 4524 Oakley Pirkle Rd
- 1447 Collins Dr
- 4121 Englewood Dr
- 511 Merrymont Dr
- 706 Muscadine Ct
Your Personal Tour Guide
Ask me questions while you tour the home.