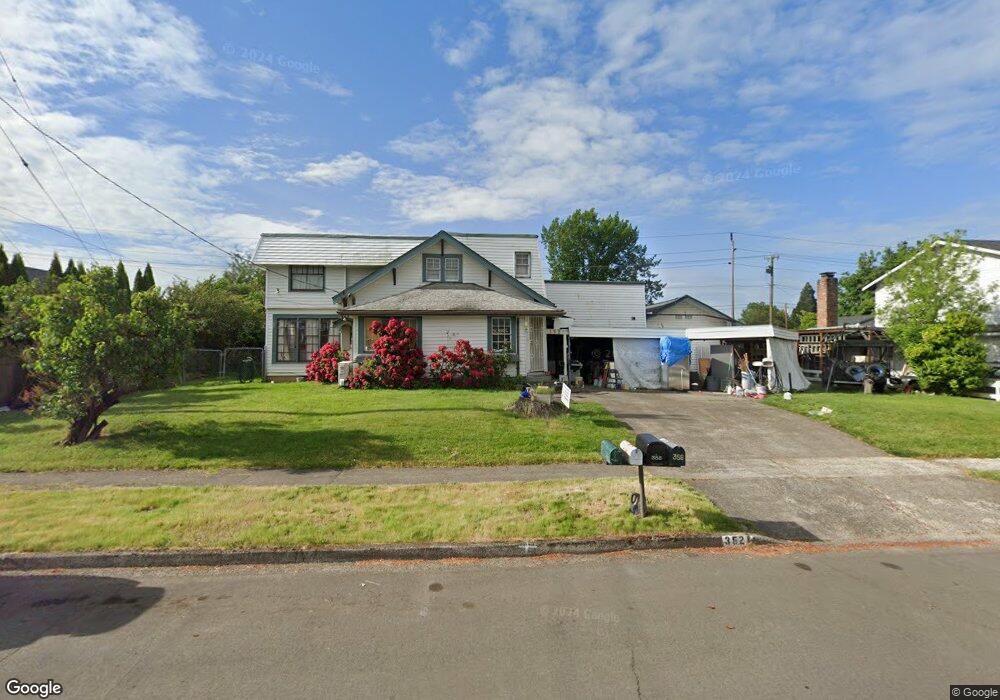
352 Ruby Ave Eugene, OR 97404
Santa Clara NeighborhoodEstimated Value: $476,000 - $652,000
5
Beds
2
Baths
2,722
Sq Ft
$199/Sq Ft
Est. Value
About This Home
This home is located at 352 Ruby Ave, Eugene, OR 97404 and is currently estimated at $542,588, approximately $199 per square foot. 352 Ruby Ave is a home located in Lane County with nearby schools including Spring Creek Elementary School, Madison Middle School, and North Eugene High School.
Ownership History
Date
Name
Owned For
Owner Type
Purchase Details
Closed on
Jul 19, 2004
Sold by
Atkin Dale W and Atkin Mary Janice
Bought by
Brougher Ken and Brougher Lynette
Current Estimated Value
Home Financials for this Owner
Home Financials are based on the most recent Mortgage that was taken out on this home.
Original Mortgage
$128,000
Outstanding Balance
$63,244
Interest Rate
6.27%
Mortgage Type
Purchase Money Mortgage
Estimated Equity
$479,344
Purchase Details
Closed on
Dec 17, 2003
Sold by
Va
Bought by
Atkin Dale W and Atkin Mary Janice
Home Financials for this Owner
Home Financials are based on the most recent Mortgage that was taken out on this home.
Original Mortgage
$126,600
Interest Rate
5.97%
Mortgage Type
Credit Line Revolving
Create a Home Valuation Report for This Property
The Home Valuation Report is an in-depth analysis detailing your home's value as well as a comparison with similar homes in the area
Home Values in the Area
Average Home Value in this Area
Purchase History
| Date | Buyer | Sale Price | Title Company |
|---|---|---|---|
| Brougher Ken | $160,000 | Western Pioneer Title Co | |
| Atkin Dale W | -- | Western Title & Escrow Co |
Source: Public Records
Mortgage History
| Date | Status | Borrower | Loan Amount |
|---|---|---|---|
| Open | Brougher Ken | $128,000 | |
| Previous Owner | Atkin Dale W | $126,600 | |
| Closed | Brougher Ken | $32,000 |
Source: Public Records
Tax History
| Year | Tax Paid | Tax Assessment Tax Assessment Total Assessment is a certain percentage of the fair market value that is determined by local assessors to be the total taxable value of land and additions on the property. | Land | Improvement |
|---|---|---|---|---|
| 2025 | $3,445 | $269,166 | -- | -- |
| 2024 | $3,427 | $261,327 | -- | -- |
| 2023 | $3,427 | $253,716 | $0 | $0 |
| 2022 | $3,221 | $246,327 | $0 | $0 |
| 2021 | $2,955 | $239,153 | $0 | $0 |
| 2020 | $3,011 | $232,188 | $0 | $0 |
| 2019 | $2,899 | $225,426 | $0 | $0 |
| 2018 | $2,670 | $212,486 | $0 | $0 |
| 2017 | $2,564 | $212,486 | $0 | $0 |
| 2016 | $2,413 | $206,297 | $0 | $0 |
| 2015 | $2,314 | $200,288 | $0 | $0 |
| 2014 | $2,171 | $194,454 | $0 | $0 |
Source: Public Records
Map
Nearby Homes
- 303 Lenore Loop
- 401 Sterling Dr
- 2439 Quince St
- 541 Durham Ave
- 193 Santa Clara Ave
- 215 Jonquil Ave
- 2563 York St
- 200 Irving Rd
- 349 Irving Rd
- 2721 La Darrah St
- 1880 Manihi Dr
- 1755 Brentwood Ave
- 805 Impala Ave
- 1682 Hemlock St
- 190 Hunsaker Ln
- 389 Maxwell Rd
- 1566 Maywood Ave
- 2640 Green Villa Ln
- 1307 Bramblewood Ln
- 2488 Northampton
- 358 Ruby Ave
- 0 Lenore Lot 18 Unit 8073858
- 364 Ruby Ave
- 393 Lenore Loop
- 0 Lenore Lot 17 Unit 9022721
- 17 Lenore
- 349 Ruby Ave
- 342 Ruby Ave
- 361 Ruby Ave
- 381 Lenore Loop
- 365 Ruby Ave
- 336 Ruby Ave
- 369 Lenore Loop
- 15 Lenore
- 376 Ruby Ave
- 2415 Leyton Ln
- 359 Lenore Loop
- 14 Lenore
- 360 Durham Ave
- 354 Durham Ave
Your Personal Tour Guide
Ask me questions while you tour the home.