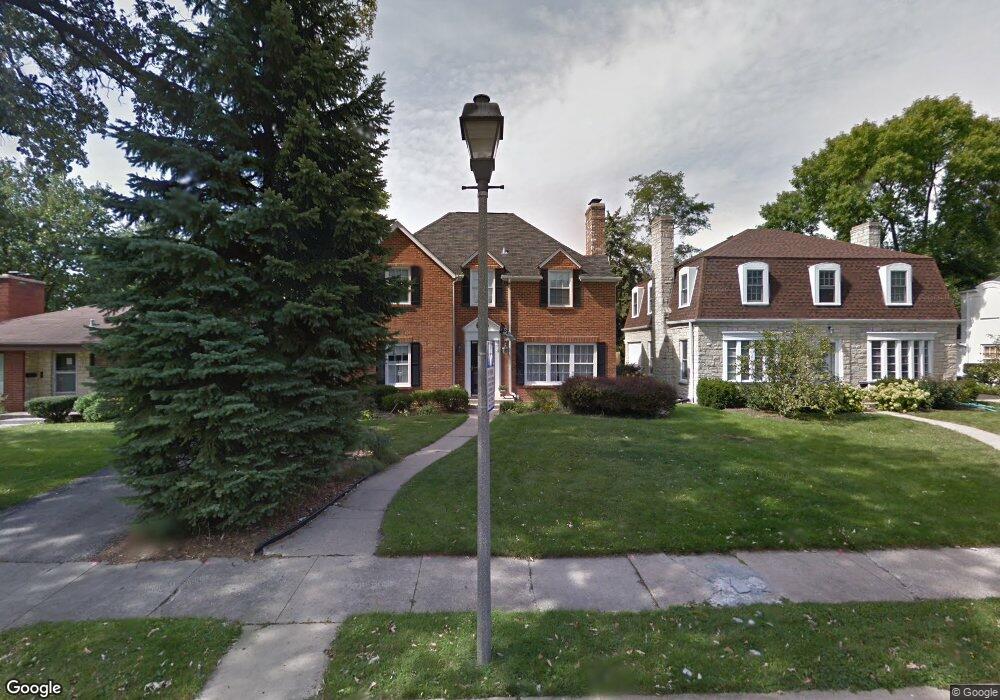
352 S Sturges Pkwy Elmhurst, IL 60126
Estimated Value: $708,000 - $898,000
3
Beds
2
Baths
1,952
Sq Ft
$406/Sq Ft
Est. Value
About This Home
This home is located at 352 S Sturges Pkwy, Elmhurst, IL 60126 and is currently estimated at $791,977, approximately $405 per square foot. 352 S Sturges Pkwy is a home located in DuPage County with nearby schools including Reinberg Elementary School, Ruggles Elementary School, and Hawthorne Elementary School.
Ownership History
Date
Name
Owned For
Owner Type
Purchase Details
Closed on
Jul 28, 2006
Sold by
Kalinich Kyle M and Kalinich Alicia M
Bought by
Oleary John J and Oleary Renee C
Current Estimated Value
Home Financials for this Owner
Home Financials are based on the most recent Mortgage that was taken out on this home.
Original Mortgage
$472,000
Outstanding Balance
$273,402
Interest Rate
6.12%
Mortgage Type
Purchase Money Mortgage
Estimated Equity
$518,575
Purchase Details
Closed on
Jun 21, 1996
Sold by
Koch David F and Koch Ruth C
Bought by
Kalinich Kyle M and Kalinich Alicia M
Home Financials for this Owner
Home Financials are based on the most recent Mortgage that was taken out on this home.
Original Mortgage
$207,000
Interest Rate
8.29%
Mortgage Type
Balloon
Create a Home Valuation Report for This Property
The Home Valuation Report is an in-depth analysis detailing your home's value as well as a comparison with similar homes in the area
Home Values in the Area
Average Home Value in this Area
Purchase History
| Date | Buyer | Sale Price | Title Company |
|---|---|---|---|
| Oleary John J | $590,000 | First American Title | |
| Kalinich Kyle M | $305,000 | -- |
Source: Public Records
Mortgage History
| Date | Status | Borrower | Loan Amount |
|---|---|---|---|
| Open | Oleary John J | $472,000 | |
| Previous Owner | Kalinich Kyle M | $207,000 |
Source: Public Records
Tax History Compared to Growth
Tax History
| Year | Tax Paid | Tax Assessment Tax Assessment Total Assessment is a certain percentage of the fair market value that is determined by local assessors to be the total taxable value of land and additions on the property. | Land | Improvement |
|---|---|---|---|---|
| 2024 | $12,282 | $211,803 | $73,384 | $138,419 |
| 2023 | $11,405 | $195,860 | $67,860 | $128,000 |
| 2022 | $11,053 | $188,280 | $65,230 | $123,050 |
| 2021 | $10,780 | $183,600 | $63,610 | $119,990 |
| 2020 | $10,364 | $179,580 | $62,220 | $117,360 |
| 2019 | $10,148 | $170,740 | $59,160 | $111,580 |
| 2018 | $10,465 | $174,930 | $56,010 | $118,920 |
| 2017 | $10,238 | $166,690 | $53,370 | $113,320 |
| 2016 | $10,026 | $157,030 | $50,280 | $106,750 |
| 2015 | $9,929 | $146,290 | $46,840 | $99,450 |
| 2014 | $10,805 | $146,210 | $37,170 | $109,040 |
| 2013 | $10,687 | $148,270 | $37,690 | $110,580 |
Source: Public Records
Map
Nearby Homes
- 211 N Hwy N
- 219 E Saint Charles Rd
- 500 S Kenilworth Ave
- 28 Windsor Dr
- 15 Manchester Ln
- 224 E May St
- 145 S York St Unit 404
- 145 S York St Unit 322
- 131 W Adelaide St Unit 309
- 153 S Kenmore Ave
- 570 S Parkside Ave
- 105 S Cottage Hill Ave Unit 304
- 333 E Huntington Ln
- 580 S Kearsage Ave
- 611 S Prospect Ave
- 618 S Swain Ave
- 104 Evergreen Ave
- 452 W Alma St
- 199 S Linden Ave
- 349 E Parkview Ave
- 356 S Sturges Pkwy
- 348 S Sturges Pkwy
- 344 S Sturges Pkwy
- 355 S Cottage Hill Ave
- 359 S Cottage Hill Ave
- 349 S Cottage Hill Ave
- 340 S Sturges Pkwy
- 351 S Sturges Pkwy
- 355 S Sturges Pkwy
- 370 S Washington St
- 345 S Sturges Pkwy
- 134 W Saint Charles Rd
- 134 W St Charles Rd
- 339 S Cottage Hill Ave
- 138 W Saint Charles Rd
- 332 S Sturges Pkwy
- 339 S Sturges Pkwy
- 371 S Washington St
- 371 S Cottage Hill Ave
- 211 N Route 83 Hwy