Estimated Value: $624,000 - $695,000
4
Beds
3
Baths
3,185
Sq Ft
$207/Sq Ft
Est. Value
About This Home
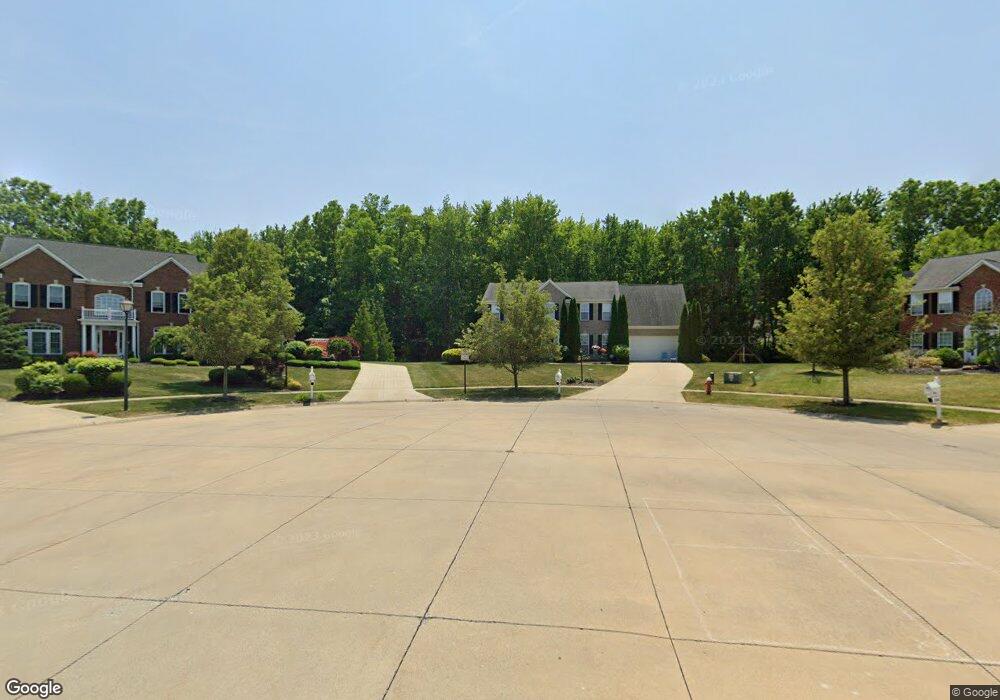
This home is located at 3520 Brandy Ct, Avon, OH 44011 and is currently estimated at $660,757, approximately $207 per square foot. 3520 Brandy Ct is a home located in Lorain County with nearby schools including Avon East Elementary School, Avon Heritage South Elementary School, and Avon Middle School.
Ownership History
Date
Name
Owned For
Owner Type
Purchase Details
Closed on
Oct 28, 2010
Sold by
Schron Chad H
Bought by
Rozycki Jonathan and Rozycki Larissa
Current Estimated Value
Home Financials for this Owner
Home Financials are based on the most recent Mortgage that was taken out on this home.
Original Mortgage
$303,311
Outstanding Balance
$201,036
Interest Rate
4.36%
Mortgage Type
FHA
Estimated Equity
$459,721
Purchase Details
Closed on
Feb 13, 2008
Sold by
Wells Erin K
Bought by
Schron Chad H
Purchase Details
Closed on
Dec 19, 2005
Sold by
Nvr Inc
Bought by
Schron Chad H and Wells Erin K
Home Financials for this Owner
Home Financials are based on the most recent Mortgage that was taken out on this home.
Original Mortgage
$339,423
Interest Rate
4.62%
Mortgage Type
Purchase Money Mortgage
Purchase Details
Closed on
Sep 28, 2005
Sold by
Avon Land Group Ltd
Bought by
Nvr Inc and Ryan Homes
Create a Home Valuation Report for This Property
The Home Valuation Report is an in-depth analysis detailing your home's value as well as a comparison with similar homes in the area
Home Values in the Area
Average Home Value in this Area
Purchase History
| Date | Buyer | Sale Price | Title Company |
|---|---|---|---|
| Rozycki Jonathan | $307,500 | Attorney | |
| Schron Chad H | -- | Attorney | |
| Schron Chad H | $357,400 | Nvr Title | |
| Nvr Inc | $74,775 | U S Title Agency Inc |
Source: Public Records
Mortgage History
| Date | Status | Borrower | Loan Amount |
|---|---|---|---|
| Open | Rozycki Jonathan | $303,311 | |
| Previous Owner | Schron Chad H | $339,423 |
Source: Public Records
Tax History Compared to Growth
Tax History
| Year | Tax Paid | Tax Assessment Tax Assessment Total Assessment is a certain percentage of the fair market value that is determined by local assessors to be the total taxable value of land and additions on the property. | Land | Improvement |
|---|---|---|---|---|
| 2024 | $9,680 | $192,469 | $55,825 | $136,644 |
| 2023 | $8,547 | $151,004 | $48,346 | $102,659 |
| 2022 | $8,468 | $151,004 | $48,346 | $102,659 |
| 2021 | $8,485 | $151,004 | $48,346 | $102,659 |
| 2020 | $8,183 | $136,650 | $43,750 | $92,900 |
| 2019 | $8,023 | $136,650 | $43,750 | $92,900 |
| 2018 | $7,040 | $129,190 | $43,750 | $85,440 |
| 2017 | $6,424 | $109,830 | $24,990 | $84,840 |
| 2016 | $6,502 | $109,830 | $24,990 | $84,840 |
| 2015 | $6,566 | $109,830 | $24,990 | $84,840 |
| 2014 | $5,796 | $97,610 | $22,050 | $75,560 |
| 2013 | $5,827 | $97,610 | $22,050 | $75,560 |
Source: Public Records
Map
Nearby Homes
- 33423 Augusta Way
- 33501 Reserve Way at Saint Andrews
- 33709 Vineyard Park
- Scottsdale Plan at The Reserve at Mass Estates - Estate Series
- Rockport Plan at The Reserve at Mass Estates - Estate Series
- Rivendale Plan at The Reserve at Mass Estates - Estate Series
- Mayfield Plan at The Reserve at Mass Estates - Estate Series
- Kensington Plan at The Reserve at Mass Estates - Estate Series
- Aspen Plan at The Reserve at Mass Estates - Estate Series
- 4110 St Gregory Way
- 4114 St Gregory Way
- 4118 St Gregory Way
- 3402 Mass Dr
- 33695 Schwartz Rd
- BEDFORD Plan at Fieldstone Landings
- CRESTWOOD Plan at Fieldstone Landings
- VIOLA Plan at Fieldstone Landings
- CHAMP Plan at Fieldstone Landings
- SEBASTIAN Plan at Fieldstone Landings
- BRENNAN Plan at Fieldstone Landings
- 3516 Brandy Ct
- 3517 Brandy Ct
- 3509 Brandy Ct
- 3510 Brandy Ct
- 3537 Brook Ct
- 33401 Tullis Dr
- 3527 Brook Ct
- 3522 Napa Blvd
- 3547 Brook Ct
- 3514 Napa Blvd
- 3517 Brook Ct
- 3501 Brandy Ct
- 33423 Streamview Dr
- 33443 Streamview Dr
- 3507 Brook Ct
- 3548 Brook Ct
- 3497 Brook Ct
- 33415 Streamview Dr
- 3538 Brook Ct
- 3518 Brook Ct